In this lesson you will explore continuity at a point, investigate discontinuity at a point, display discontinuities, and learn how to redefine a function to remove a point discontinuity. You will then use the TI-83 to graph piecewise defined functions.
Informally, a function is said to be continuous on an interval if you can sketch its graph on the interval without lifting your pencil off the paper. The formal definition of continuity starts by defining continuity at a point and then extends to continuity on an interval. The formal definition may not seem to have much in common with the concept of sketching a graph without lifting your pencil off the paper, but after investigating several examples with your TI-83, the connection between the formal and informal definitions should be more apparent.
Continuity at a Point and on an Interval
The formal definition of continuity at a point has three conditions that must be met.
A function f(x) is continuous at a point where x = c if
-
 exists
- f(c) exists (That is, c is in the domain of f.)
-

A function is continuous on an interval if it is continuous at every point in the interval.
Discontinuity at a Point
The definition for continuity at a point may make more sense as you see it applied to functions with discontinuities. If any of the three conditions in the definition of continuity fails when x = c, the function is discontinuous at that point. Examine the continuity of
![]() when x = 0.
when x = 0.
Checking the Conditions for Continuity
-
The limit of the function
 as x approaches 0 was discussed in Lesson 6.3 where it was shown that
 . Therefore, the first condition for continuity is satisfied.
-
The function
 is not defined at x = 0 because division by 0 is undefined. The function fails the second condition for continuity because 0 is not in the domain of f.
- There is no need to verify the third condition because the second condition failed.
By the definition of continuity, you can conclude that
![]() is not continuous at x = 0.
is not continuous at x = 0.
Displaying Discontinuities
A discontinuity at a point may be illustrated by graphing the function in an appropriate window. The discontinuity only shows up if it is at an x-value used in the plot. It is difficult (it might be impossible) to force it to show up at a point like
![]() or
or
![]() .
.
- Enter Y1 = sin(X)/X in the Y= editor.
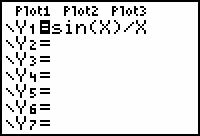
The y-axis will need to be turned off in order to see the discontinuity at x = 0.
-
Open the Format menu by pressing
 [FORMAT], which is above
 .
.
-
Use the arrow keys to highlight "AxesOff" and press
 .
.
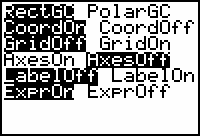
- Graph the function in a [-6, 6, 1] x [-1, 2, 1] window with Xres = 1.
-
Explore the function with the Trace feature to see that
 is not defined at x = 0.
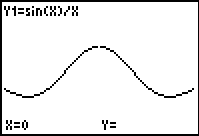
The discontinuity is represented as a hole in the graph at the point with coordinates (0,1).
|
|||
|
|
|||
Removing the Discontinuity
The following shows how
![]() can be redefined to create a new function that is exactly like the original function for all non-zero values of x, but is continuous at x = 0.
can be redefined to create a new function that is exactly like the original function for all non-zero values of x, but is continuous at x = 0.
Define a new function g(x) to be the function whose values are
![]() for
for
![]() and y = 1 for x = 0.
and y = 1 for x = 0.
That is,

This new function is called a piecewise function because different formulas are applied to different parts of the domain. The graph of g(x) is the same as the graph of
![]() except it includes the point (0,1), the point that fills the hole.
except it includes the point (0,1), the point that fills the hole.
Graphing a Piecewise Function
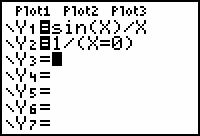
You can graph the piecewise function by entering the two pieces in Y1 and Y2. The first piece should already be in Y1. ( Y1 = sin(X)/X )
-
Enter Y2 = 1/(X=0).
The "=" symbol can be pasted to the Y= editor from the Test menu by pressing [TEST]
 .
.
|
|||
|
|
|||
-
Display the new continuous graph by pressing
 .
.
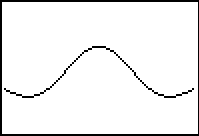
The hole at (0, 1) has been filled.
Turning the Axes Back On
Before leaving this lesson you should turn the graphing axes on.
-
Return to the Format menu by pressing
 [FORMAT].
- Use the arrow keys to highlight "AxesOn."
-
Select this setting by pressing
 .
.
-
Exit the Format menu by pressing
 [QUIT].
8.1.1 Redefine
![]() to make it continuous at x = 2. Click here for the answer.
to make it continuous at x = 2. Click here for the answer.