Note: Rescaling in the Graphs application affects only the graphs, plots, and objects that reside in the Graphing view. It has no effect on objects in the underlying Plane Geometry view.
| ▶ | To rescale the x and y axes proportionally, pinch the work area. |
| ▶ | To rescale only one axis, tap Tools  , select Actions > Constrained Movement, and then drag along the axis. , select Actions > Constrained Movement, and then drag along the axis. |
| ▶ | Tap Tools , select Window/Zoom, and select one of the predefined Zoom settings. The initial setting is Zoom - Standard. |
| 1. | In the Graphs application, tap Tools and go to View > Grid. |
| 2. | Tap Dot Grid, Lined Grid, or (if the grid is already displayed) No Grid. |
| 1. | In the Graphs application, tap Tools and go to Actions > Select Grid. |
The grid will flash.
| 2. | Tap the Inspector  to show a list of attributes that you can change. to show a list of attributes that you can change. |
| 1. | Tap either axis to select the axes. |
| 2. | Tap the Inspector to show a list of attributes that you can change. |
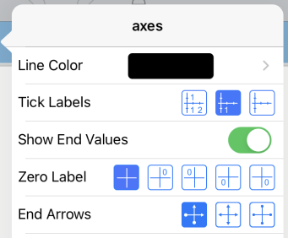
| 3. | Select the items to change. Changes are applied as you select them. |
Multiple labels are only displayed if they fit both horizontally and vertically on the axes. Rescale the Axes if necessary by pinching or spreading either the horizontal or vertical axis to modify its scale.
– OR –
Drag either axis to shift the axis while retaining its scale.
To restore the original size and location of the plotted data, tap Tools > Window / Zoom > Zoom-Data.
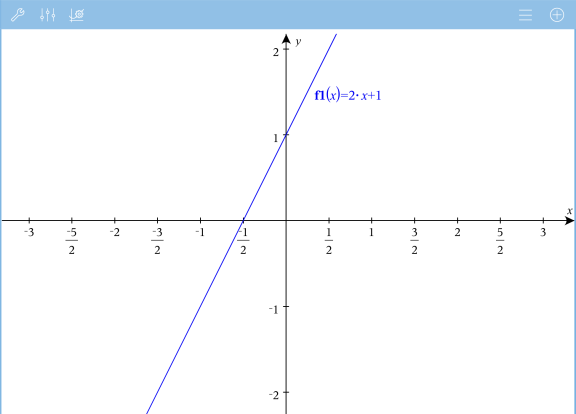
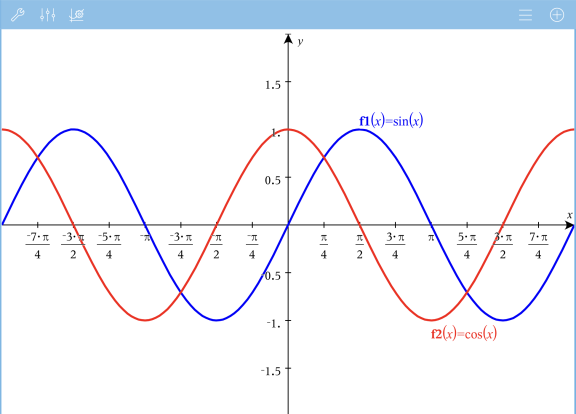
Exact Arithmetic and CAS Only: You can change the tick mark labels to display multiples of Pi, radical numbers, and other exact values by editing the XScale or YScale values in the Window / Zoom > Settings.
Note: pi/2 will be converted to p/2 after clicking OK.
Note: For information about path plots, see Exploring Graphs with Path Plot.