Note: To avoid unexpected results when using this feature, make sure the document setting for "Real or Complex Format" is set to Real.
You can use the Graphs application to access the area between curves.
When you calculate the area between curves, each curve must be:
| • | A function with respect to x. |
– OR –
| • | An equation in the form y=, including y= equations defined through a text box or a conic equation template. |
| 1. | Open a new Graphs page. |
| 2. | Tap sin and x, then tap enter. |
| 3. | Tap  . . |
| 4. | Tap cos and x, then tap enter. |
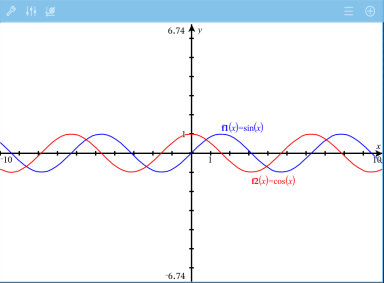
For this example the graph now shows f1(x)=sin(x) and f2(x)=cos(x) function(s).
| 5. | Tap Tools  and go to Analyze Graph > Bounded Area. and go to Analyze Graph > Bounded Area. |
The Bounded Area tool  appears in the application Toolbar. You are prompted to set the lower and upper bounds.
| 6. | Tap or drag two points to define the bounds. |
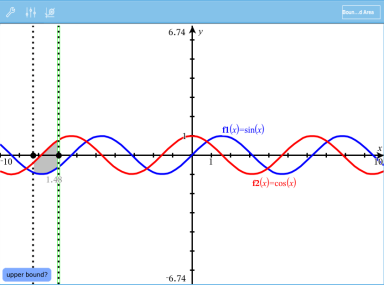
The area becomes shaded, and the area value is displayed. The value is always non-negative, regardless of the interval direction.
As you change the bounds or redefine the curves, the shading and the area value are updated.
| • | To change the lower or upper bound, drag it or type new coordinates for it. You cannot move a bound that resides on an intersection. However, the point moves automatically as you edit or manipulate the curves. |
| • | To redefine a curve, either manipulate it by dragging or edit its expression in the entry line. |
Note: If an endpoint resided originally on an intersection, and the redefined functions no longer intersect, the shading and area value disappear. If you redefine the function(s) so that there is an intersection point, the shading and area value reappear.
| • | To delete or hide an area, tap to select the bounded area, then tap again to see the context menu. From the context menu, you may delete the bounded area. |
| • | To change the color and other attributes, tap the Object Inspector once the shaded region is selected. |