|
Catalog > |
|
|
Matrix1T ⇒ matrix Returns the complex conjugate transpose of Matrix1. Note: You can insert this operator from the computer keyboard by typing @t. |
|
|
µ key |
|
|
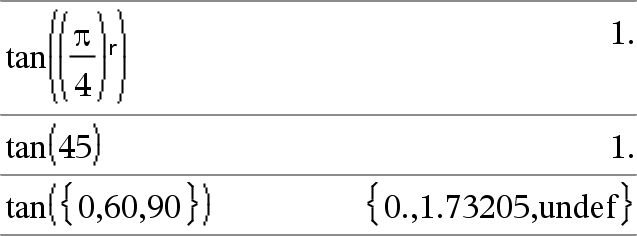
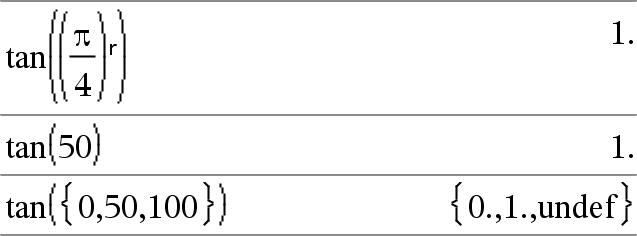
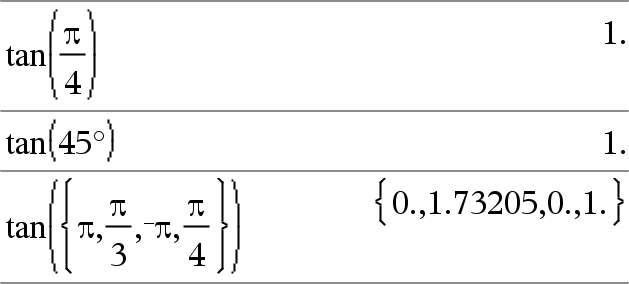
tan(List1) returns a list of the tangents of all elements in List1. Note: The argument is interpreted as a degree, gradian or radian angle, according to the current angle mode. You can use °, g or r to override the angle mode setting temporarily. |
In Degree angle mode:
|
|
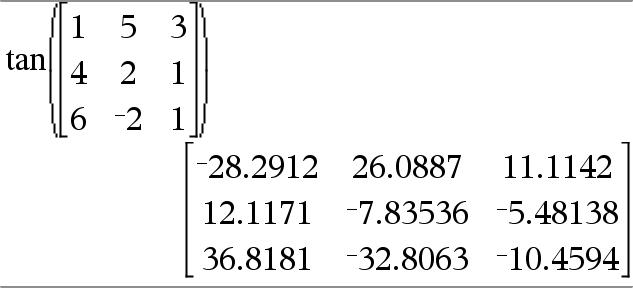
tan(squareMatrix1) ⇒ squareMatrix Returns the matrix tangent of squareMatrix1. This is not the same as calculating the tangent of each element. For information about the calculation method, refer to cos(). squareMatrix1 must be diagonalizable. The result always contains floating-point numbers. |
In Radian angle mode:
|
|
µ key |
|
|
tan-1(Value1) ⇒ value tan-1(List1) ⇒ list tan-1(Value1) returns the angle whose tangent is Value1. tan-1(List1) returns a list of the inverse tangents of each element of List1. Note: The result is returned as a degree, gradian or radian angle, according to the current angle mode setting. Note: You can insert this function from the keyboard by typing arctan(...). |
In Degree angle mode:
|
|
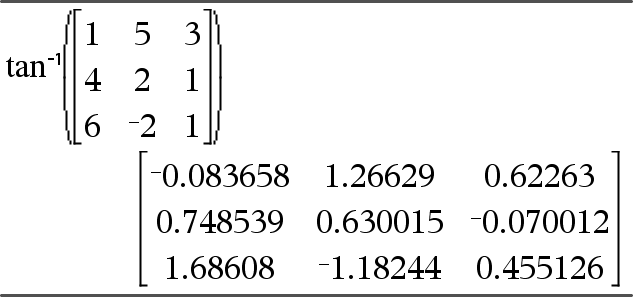
tan-1(squareMatrix1) ⇒ squareMatrix Returns the matrix inverse tangent of squareMatrix1. This is not the same as calculating the inverse tangent of each element. For information about the calculation method, refer to cos(). squareMatrix1 must be diagonalizable. The result always contains floating-point numbers. |
In Radian angle mode:
|
|
Catalog > |
|
|
tanh(Value1) ⇒ value tanh(List1) ⇒ list tanh(Value1) returns the hyperbolic tangent of the argument. tanh(List1) returns a list of the hyperbolic tangents of each element of List1. |
|
|
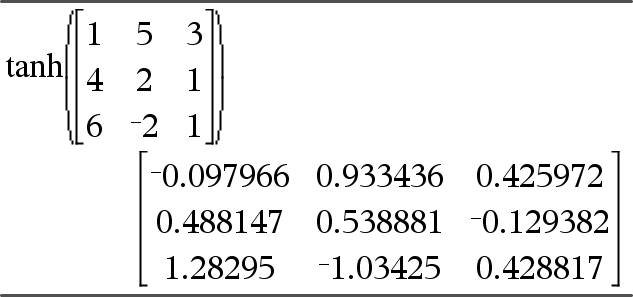
tanh(squareMatrix1) ⇒ squareMatrix Returns the matrix hyperbolic tangent of squareMatrix1. This is not the same as calculating the hyperbolic tangent of each element. For information about the calculation method, refer to cos(). squareMatrix1 must be diagonalizable. The result always contains floating-point numbers. |
In Radian angle mode:
|
|
Catalog > |
|
|
tanh-1(Value1) returns the inverse hyperbolic tangent of the argument. tanh-1(List1) returns a list of the inverse hyperbolic tangents of each element of List1. Note: You can insert this function from the keyboard by typing arctanh(...). |
In Rectangular complex format:
To see the entire result, |
|
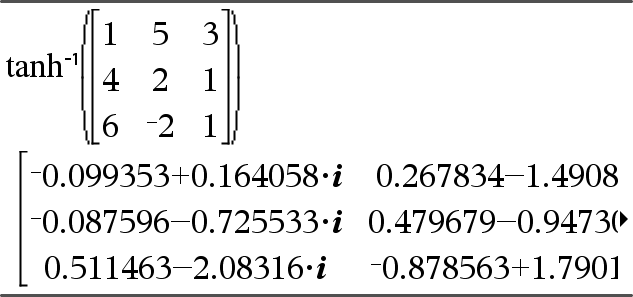
tanh-1(squareMatrix1) ⇒ squareMatrix Returns the matrix inverse hyperbolic tangent of squareMatrix1. This is not the same as calculating the inverse hyperbolic tangent of each element. For information about the calculation method, refer to cos(). squareMatrix1 must be diagonalizable. The result always contains floating-point numbers. |
In Radian angle mode and Rectangular complex format:
To see the entire result, |
|
Catalog > |
|
|
tCdf(lowBound,upBound,df) ⇒ number if lowBound and upBound are numbers, list if lowBound and upBound are lists Computes the Student-t distribution probability between lowBound and upBound for the specified degrees of freedom df. For P(X ≤ upBound), set lowBound = -9E999. |
|
|
Catalog > |
|||||||
|
Programming command: Pauses the program and displays the character string promptString in a dialog box. When the user selects OK, program execution continues. The optional flag argument can be any expression.
If the program needs a typed response from the user, refer to Note: You can use this command within a user-defined program but not within a function. |
Define a program that pauses to display each of five random numbers in a dialog box. Within the Prgm...EndPrgm template, complete each line by pressing @ instead of ·. On the computer keyboard, hold down Alt and press Enter.
Define text_demo()=Prgm
Run the program: text_demo()
Sample of one dialog box:
|
|
See If, here. |
|
|
|
|
|
Catalog > |
|
|
tInterval List[, Freq[, CLevel]] (Data list input) tInterval v, sx, n[, CLevel] (Summary stats input) Computes a t confidence interval. A summary of results is stored in the stat.results variable. (See here.) For information on the effect of empty elements in a list, see “Empty (Void) Elements,” here. |
|
|
Output variable |
Description |
|
stat.CLower, stat.CUpper |
Confidence interval for an unknown population mean |
|
stat.v |
Sample mean of the data sequence from the normal random distribution |
|
stat.ME |
Margin of error |
|
stat.df |
Degrees of freedom |
|
stat.σx |
Sample standard deviation |
|
stat.n |
Length of the data sequence with sample mean |
|
Catalog > |
|
|
tInterval_2Samp List1,List2[,Freq1[,Freq2[,CLevel[,Pooled]]]] (Data list input) tInterval_2Samp v1,sx1,n1,v2,sx2,n2[,CLevel[,Pooled]] (Summary stats input) Computes a two-sample t confidence interval. A summary of results is stored in the stat.results variable. (See here.) Pooled=1 pools variances; Pooled=0 does not pool variances. For information on the effect of empty elements in a list, see “Empty (Void) Elements,” here. |
|
|
Output variable |
Description |
|
stat.CLower, stat.CUpper |
Confidence interval containing confidence level probability of distribution |
|
stat.v1-v2 |
Sample means of the data sequences from the normal random distribution |
|
stat.ME |
Margin of error |
|
stat.df |
Degrees of freedom |
|
stat.v1, stat.v2 |
Sample means of the data sequences from the normal random distribution |
|
stat.σx1, stat.σx2 |
Sample standard deviations for List 1 and List 2 |
|
stat.n1, stat.n2 |
Number of samples in data sequences |
|
stat.sp |
The pooled standard deviation. Calculated when Pooled = YES |
|
Catalog > |
|
|
tPdf(XVal,df) ⇒ number if XVal is a number, list if XVal is a list Computes the probability density function (pdf) for the Student-t distribution at a specified x value with specified degrees of freedom df. |
|
|
Catalog > |
|
|
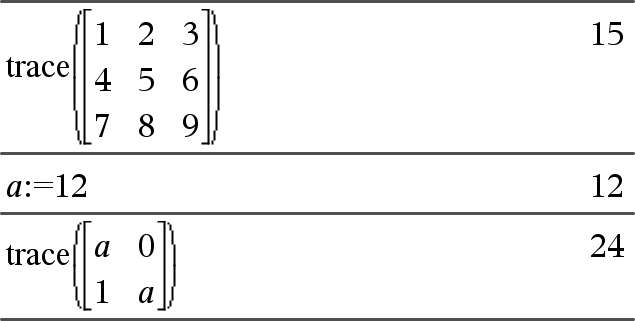
trace(squareMatrix) ⇒ value Returns the trace (sum of all the elements on the main diagonal) of squareMatrix. |
|
|
Catalog > |
|
|
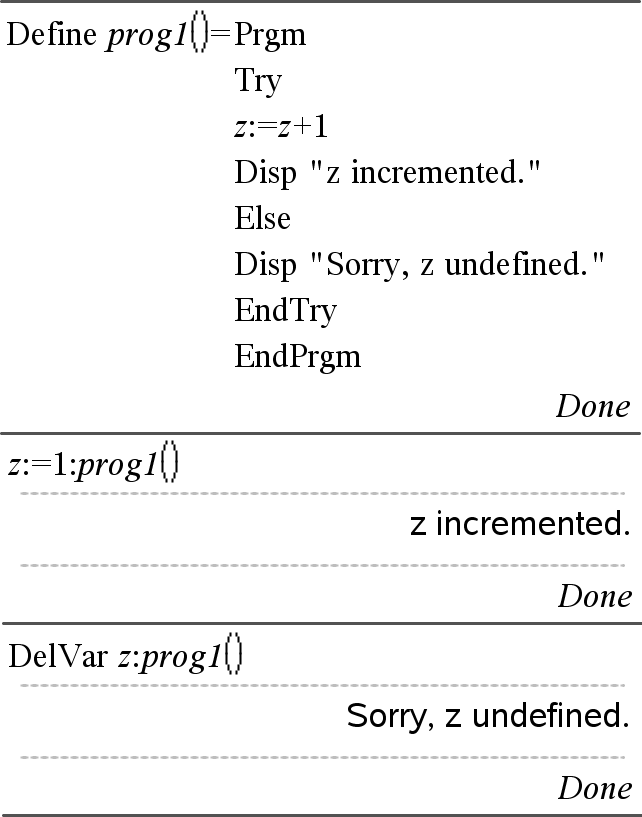
Try Executes block1 unless an error occurs. Program execution transfers to block2 if an error occurs in block1. System variable errCode contains the error code to allow the program to perform error recovery. For a list of error codes, see “Error codes and messages,” here. block1 and block2 can be either a single statement or a series of statements separated with the “:” character. Note for entering the example: For instructions on entering multi-line program and function definitions, refer to the Calculator section of your product guidebook. |
|
|
To see the commands Try, ClrErr, and PassErr in operation, enter the eigenvals() program shown at the right. Run the program by executing each of the following expressions.
|
Define eigenvals(a,b)=Prgm Try Disp "Eigenvalues of A•B are:",eigVl(a*b) Else EndPrgm
|
|
Catalog > |
|
|
tTest μ0,List[,Freq[,Hypoth]] (Data list input) tTest μ0,v,sx,n,[Hypoth] (Summary stats input) Performs a hypothesis test for a single unknown population mean μ when the population standard deviation σ is unknown. A summary of results is stored in the stat.results variable. (See here.) Test H0: μ = μ0, against one of the following: For Ha: μ < μ0, set Hypoth<0 For information on the effect of empty elements in a list, see “Empty (Void) Elements,” here. |
|
|
Output variable |
Description |
|
stat.t |
(v − μ0) / (stdev / sqrt(n)) |
|
stat.PVal |
Smallest level of significance at which the null hypothesis can be rejected |
|
stat.df |
Degrees of freedom |
|
stat.v |
Sample mean of the data sequence in List |
|
stat.sx |
Sample standard deviation of the data sequence |
|
stat.n |
Size of the sample |
|
Catalog > |
|
|
tTest_2Samp List1,List2[,Freq1[,Freq2[,Hypoth[,Pooled]]]] (Data list input) tTest_2Samp v1,sx1,n1,v2,sx2,n2[,Hypoth[,Pooled]] (Summary stats input) Computes a two-sample t test. A summary of results is stored in the stat.results variable. (See here.) Test H0: μ1 = μ2, against one of the following: For Ha: μ1< μ2, set Hypoth<0 Pooled=1 pools variances For information on the effect of empty elements in a list, see “Empty (Void) Elements,” here. |
|
Output variable |
Description |
|
stat.t |
Standard normal value computed for the difference of means |
|
stat.PVal |
Smallest level of significance at which the null hypothesis can be rejected |
|
stat.df |
Degrees of freedom for the t-statistic |
|
stat.v1, stat.v2 |
Sample means of the data sequences in List 1 and List 2 |
|
stat.sx1, stat.sx2 |
Sample standard deviations of the data sequences in List 1 and List 2 |
|
stat.n1, stat.n2 |
Size of the samples |
|
stat.sp |
The pooled standard deviation. Calculated when Pooled=1. |
|
Catalog > |
|
|
tvmFV(N,I,PV,Pmt,[PpY],[CpY],[PmtAt]) ⇒ value Financial function that calculates the future value of money. Note: Arguments used in the TVM functions are described in the table of TVM arguments, here. See also amortTbl(), here. |
|
|
Catalog > |
|
|
tvmI(N,PV,Pmt,FV,[PpY],[CpY],[PmtAt]) ⇒ value Financial function that calculates the interest rate per year. Note: Arguments used in the TVM functions are described in the table of TVM arguments, here. See also amortTbl(), here. |
|
|
Catalog > |
|
|
tvmN(I,PV,Pmt,FV,[PpY],[CpY],[PmtAt]) ⇒ value Financial function that calculates the number of payment periods. Note: Arguments used in the TVM functions are described in the table of TVM arguments, here. See also amortTbl(), here. |
|
|
Catalog > |
|
|
tvmPmt(N,I,PV,FV,[PpY],[CpY],[PmtAt]) ⇒ value Financial function that calculates the amount of each payment. Note: Arguments used in the TVM functions are described in the table of TVM arguments, here. See also amortTbl(), here. |
|
|
Catalog > |
|
|
tvmPV(N,I,Pmt,FV,[PpY],[CpY],[PmtAt]) ⇒ value Financial function that calculates the present value. Note: Arguments used in the TVM functions are described in the table of TVM arguments, here. See also amortTbl(), here. |
|
|
Description |
Data type |
|
|
N |
Number of payment periods |
real number |
|
I |
Annual interest rate |
real number |
|
PV |
Present value |
real number |
|
Pmt |
Payment amount |
real number |
|
FV |
Future value |
real number |
|
PpY |
Payments per year, default=1 |
integer > 0 |
|
CpY |
Compounding periods per year, default=1 |
integer > 0 |
|
PmtAt |
Payment due at the end or beginning of each period, default=end |
integer (0=end, 1=beginning) |
* These time-value-of-money argument names are similar to the TVM variable names (such as tvm.pv and tvm.pmt) that are used by the Calculator application’s finance solver. Financial functions, however, do not store their argument values or results to the TVM variables.
|
Catalog > |
|
|
TwoVar X, Y[, [Freq][, Category, Include]] Calculates the TwoVar statistics. A summary of results is stored in the stat.results variable. (See here.) All the lists must have equal dimension except for Include. X and Y are lists of independent and dependent variables. Freq is an optional list of frequency values. Each element in Freq specifies the frequency of occurrence for each corresponding X and Y data point. The default value is 1. All elements must be integers ≥ 0. Category is a list of numeric category codes for the corresponding X and Y data. Include is a list of one or more of the category codes. Only those data items whose category code is included in this list are included in the calculation. An empty (void) element in any of the lists X, Freq, or Category results in a void for the corresponding element of all those lists. An empty element in any of the lists X1 through X20 results in a void for the corresponding element of all those lists. For more information on empty elements, see here. |
|
|
Output variable |
Description |
|
stat.v |
Mean of x values |
|
stat.Σx |
Sum of x values |
|
stat.Σx2 |
Sum of x2 values |
|
stat.sx |
Sample standard deviation of x |
|
stat.σx |
Population standard deviation of x |
|
stat.n |
Number of data points |
|
stat.w |
Mean of y values |
|
stat.Σy |
Sum of y values |
|
stat.Σy2 |
Sum of y2 values |
|
stat.sy |
Sample standard deviation of y |
|
stat.σy |
Population standard deviation of y |
|
stat.Σxy |
Sum of x•y values |
|
stat.r |
Correlation coefficient |
|
stat.MinX |
Minimum of x values |
|
stat.Q1X |
1st Quartile of x |
|
stat.MedianX |
Median of x |
|
stat.Q3X |
3rd Quartile of x |
|
stat.MaxX |
Maximum of x values |
|
stat.MinY |
Minimum of y values |
|
stat.Q1Y |
1st Quartile of y |
|
stat.MedY |
Median of y |
|
stat.Q3Y |
3rd Quartile of y |
|
stat.MaxY |
Maximum of y values |
|
stat.Σ(x-v)2 |
Sum of squares of deviations from the mean of x |
|
stat.Σ(y-w)2 |
Sum of squares of deviations from the mean of y |


