Curves described using polar coordinates can be very interesting and the equations are often much simpler in polar form than they are in rectangular form. This lesson explores graphing polar equations.
When graphing polar functions on the TI-83,
-
 is the independent variable and r is the dependent variable.
- Angles are positive if measured in the counterclockwise direction from the positive x-axis.
|
|||
|
|
|||
Graphing in Polar Mode
- Change to Polar Graphing mode.
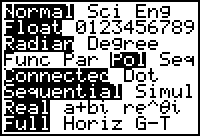
Graph the polar functions r = 3 sin(2
![]() ).
).
-
Open the Y= editor by pressing
 . The function editor in Polar Graphing mode is still called the Y= editor, even though the functions are denoted by r1, r2, and so forth.
-
Set r1 = 3sin(2
 ). Press
 for
for
 .
.

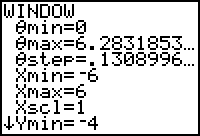
- Enter the following window values:
|
|
Xmin = –6 | Ymin = –4 |
|
|
Xmax = 6 | Ymax = 4 |
|
|
Xscl = 1 | Yscl = 1 |
These window values will be abbreviated as [0, 2
![]() ,
,
![]() /24] x [-6, 6, 1] x [-4, 4, 1]. The
/24] x [-6, 6, 1] x [-4, 4, 1]. The
![]() values will range from 0 to 2
values will range from 0 to 2
![]() in steps of
in steps of
![]() /24 and the display window will be determined by the x- and y-values.
/24 and the display window will be determined by the x- and y-values.
- Display the graph.
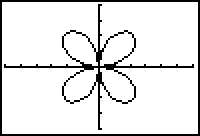
This graph is called a four-leafed rose.
27.2.1 Predict the shape of the graph of r = 3sin(3
![]() ) then verify your prediction by displaying the graph on your TI-83. Click here for the answer.
) then verify your prediction by displaying the graph on your TI-83. Click here for the answer.
Finding the Number of Leaves
There is a relationship between the value of n in the polar function r = 3sin(n
![]() ) and the number of leaves.
) and the number of leaves.
27.2.2 Determine how n relates to the number of leaves in the graph of r = 3sin(n
![]() ) by graphing the following polar functions. You will need to adjust
) by graphing the following polar functions. You will need to adjust
![]() to 2
to 2
![]() for the functions where n is even and to
for the functions where n is even and to
![]() when n is odd. You may also want to make
when n is odd. You may also want to make
![]() smaller for the last few functions in order to make the graphs smooth.
smaller for the last few functions in order to make the graphs smooth.
r = 3sin(4
![]() )
)
r = 3sin(5
![]() )
)
r = 3sin(6
![]() )
)
r = 3sin(7
![]() )
)
Click here for the answer.
27.2.3 How many leaves would you expect in the graph of
![]() ? Let
? Let
![]() and graph the function to verify your prediction. Click here for the answer.
and graph the function to verify your prediction. Click here for the answer.
Graphing a Cardioid
-
Define the window [0, 2
 ,
,
 /24] x [-6, 6, 1] x [-4, 4, 1].
-
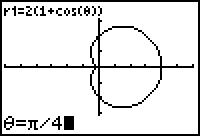
Graph the polar function r = 2(1 + cos
 ).
).
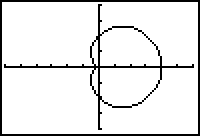
The graph is called a cardioid because it is heart shaped. It is one of several interesting shapes that are common polar functions.
Finding the Slope of a Tangent Line
The Derivative feature in the CALC menu, dy/dx, can be used to find the slope of the line tangent to the cardioid
-
Open the CALC menu by pressing
 [CALC].
- Highlight 2:dy/dx.

-
Select this feature by pressing
 .
.
-
Enter
 /4. This value will be entered for
 .
.
-
Press
 to find the derivative dy/dx.
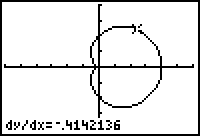
The slope of the tangent line to the cardioid at
![]() is approximately -0.414.
is approximately -0.414.
|
|||
|
|
|||
Cardioids and Limaçons
The equation r = a + bcos
![]() represents several families of polar curves depending on the relative values of a and b.
represents several families of polar curves depending on the relative values of a and b.
27.2.4 Experiment with this equation using a = b, a > b and a < b. How do the relative values of a and b affect the graph? Click here for the answer.