In Lesson 1.1 you defined the function f(x) = 2x2 - 5x - 3 and found its roots using Guess and Check and by factoring. In this lesson you will display this function graphically and use the graph to find the zeros of the function.
Graphing a Function
Functions must be defined in the Y= editor before they can be graphed. Even if you turned off your calculator after completing Lesson 1.1, the function f(x) = 2x2 - 5x - 3 should still be defined in Y1.
-
Verify this by pressing
 .
.
Setting the Viewing Window
Before you graph the function, you need to specify the
Viewing window.
![]()
![]()
The viewing window represents the portion of the coordinate plane displayed on the Graph screen. By setting Window variables, you can define the viewing window's boundaries and other attributes. Each of the graphing modes (function, parametric, etc.) has it's own independent set of window variables.
![]()
![]()
-
Display the Viewing window screen by pressing
 .
.
The values of the parameters of the viewing window determine the size of the portion of the coordinate plane displayed on the Graph screen.
- Xmin and Xmax determine the coordinates of the left and right sides of the window
- Ymin and Ymax determine the bottom and top of the window
- Xscl and Yscl determine the spacing between the hash marks on the x-axis and the y-axis
- Xres determines the spacing between the points that are connected to produce the graph
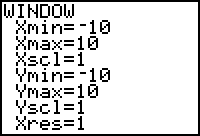
The window values shown above are appropriate for our function's graph, so we will keep them. If you need to change your window values to match those shown above, you can do this by moving the cursor to the appropriate line with the cursor movement keys
![]()
![]() and then entering the desired values.
and then entering the desired values.
Displaying a Graph
Display the graph once the window values are set.
-
Display the graph by pressing
 .
.
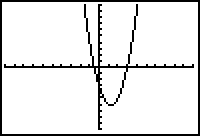
x-Intercepts and Zeros of f
In general for any real number r, r is a zero (or root) of f if and only if r is an x-intercept of the graph of f.
Finding Zeros Graphically
You can find the zeros of the function from the Graph screen by using the Zero feature, which will return the value of an x-intercept.
-
Display the CALCULATE menu by pressing
 [CALC].
[CALC] is above the graphing key.
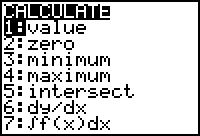
-
Select the 2:zero feature by pressing
 .
.
You will see the graph and a prompt for a left bound of an interval on the x-axis, as shown below. You must identify an x-interval containing the desired zero by specifying the left and right endpoints of the interval. It's not important that the interval be small, but the goal is to choose an interval that contains only one zero of the function. Otherwise, you might not find the zero you are looking for.
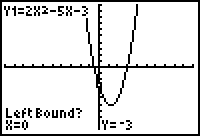
Begin by finding the larger of the two x-intercepts.
-
Use the cursor movement keys

 to move the cursor until it is just to the left of the larger x-intercept (root) and press
 . Alternatively, you can choose an appropriate left endpoint for the interval, say 2, and simply type that number and press
 .
.
After you press
![]() , a small marker appears at the top of the Graph screen above the left bound of the interval, as shown below. The calculator then asks you to indicate the right bound of the interval.
, a small marker appears at the top of the Graph screen above the left bound of the interval, as shown below. The calculator then asks you to indicate the right bound of the interval.
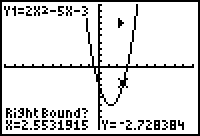
-
Use the cursor movement keys to move the cursor until it is just to the right of the root and press
 , or simply type an appropriate bound, say 4 and then press
 .
.
After you press
![]() , another small marker appears at the top of the Graph screen above the right bound. The calculator then asks you to indicate an initial guess for the root.
, another small marker appears at the top of the Graph screen above the right bound. The calculator then asks you to indicate an initial guess for the root.
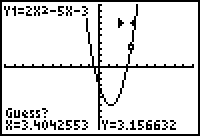
-
Use the cursor movement keys

 to move the cursor close to the desired x-intercept and press
 . Alternatively, you can simply type a value close to the zero and press
 . In either case, the value you enter for the "guess" must lie between the left and right bounds you have specified.
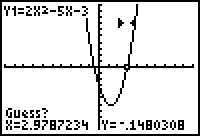
|
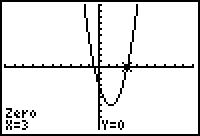
|
| Move the cursor to your guess | Press Enter |
The zero (or root) is x = 3, as shown at the bottom of the screen.
1.2.1 Use the CALCULATE Zero feature on the Graph screen to find the other root. Click here for the answer.