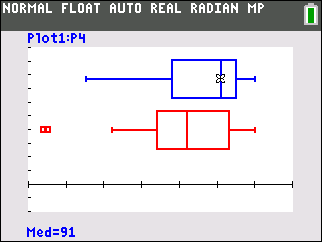
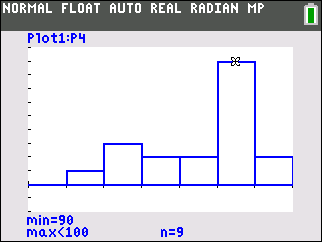
Students will represent real-world data using a histogram and box and whisker diagram.
Students will calculate measures of central tendency and spread.
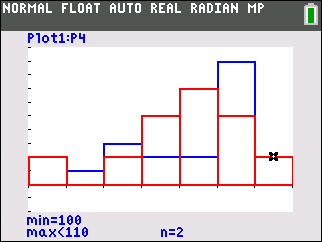
Students will compare distributions from two data sets and draw conclusions.
Students will identify and analyze outliers in a data set.
Vocabulary
Histogram
Outlier
Box and Whisker Diagram
Skew
Median
Interquartile Range
About the lesson
Students are given the results from a recent test. They will need to display the data graphically and will refresh their understanding of histograms and box and whisker diagrams.
Key Steps
Step 1
Students will represent real-world data using a histogram and box plot and calculate measures of central tendency and spread.
Step 2
Then students will compare distributions from two data sets and draw conclusions and identify and analyze outliers in a data set.
TI websites use cookies to optimize site functionality and improve your experience. To find out more or to change your preferences, see our cookie policy page. Click Agree and Proceed to accept cookies and enter the site.
Control your cookie preferences
You can control your preferences for how we use cookies to collect and use information while you're on TI websites by adjusting the status of these categories.
Category
Description
Allow
Analytics and performance cookies
These cookies, including cookies from Google Analytics, allow us to recognize and count the number of visitors on TI sites and see how visitors navigate our sites. This helps us improve the way TI sites work (for example, by making it easier for you to find information on the site).
Advertising and marketing cookies
These cookies enable interest-based advertising on TI sites and third-party websites using information you make available to us when you interact with our sites. Interest-based ads are displayed to you based on cookies linked to your online activities, such as viewing products on our sites. We may also share this information with third parties for these purposes. These cookies help us tailor advertisements to better match your interests, manage the frequency with which you see an advertisement, and understand the effectiveness of our advertising.
Functional cookies
These cookies help identify who you are and store your activity and account information in order to deliver enhanced functionality, including a more personalized and relevant experience on our sites. If you do not allow these cookies, some or all site features and services may not function properly.
If you do not allow these cookies, some or all of the site features and services may not function properly.
Social media cookies
These cookies allow identification of users and content connected to online social media, such as Facebook, Twitter and other social media platforms, and help TI improve its social media outreach.
Strictly necessary
These cookies are necessary for the operation of TI sites or to fulfill your requests (for example, to track what items you have placed into your cart on the TI.com, to access secure areas of the TI site, or to manage your configured cookie preferences).