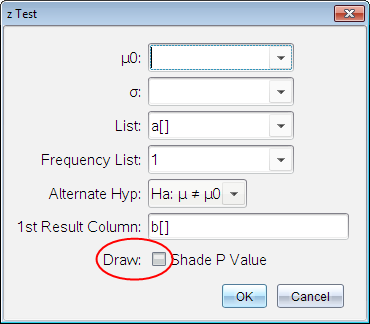
Draw check box (as shown in the z Test wizard).
Tools on the Statistics menu provide access to wizards that help you perform statistical analyses on the data in table columns. You specify the location of the data, and Lists & Spreadsheet stores the results in two columns: one for the result names, and one for the corresponding values.
Some statistics wizards include a Draw check box. By default, the box is not selected. Selecting this box creates a Data & Statistics work area on the page, displays the calculated results in Lists & Spreadsheet, and draws the results of the statistical analysis in the Data & Statistics work area.
Note: For functions that support the Draw option, the option is available only if you type the function in a column formula cell.
|
|