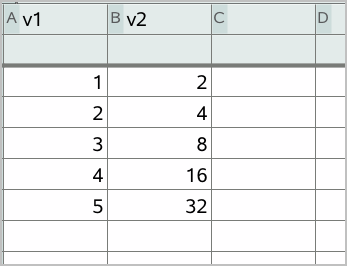
| 1. | (Optional) Create two predefined list variables containing the x and y values to plot. You can use the Lists & Spreadsheet, Calculator, or Notes application to create the lists. |
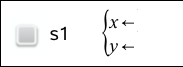
| 2. | From the Graph Entry/Edit menu, select Scatter Plot. |
Use the up and down arrow keys to move between the x and y fields.
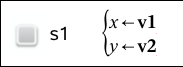
| 3. | Use one of the following methods to specify lists to plot as x and y. |
| - | Click  to select names of the predefined list variables. to select names of the predefined list variables. |
| - | Type the names of the variables, such as v1. |
| - | Type lists as comma-separated elements enclosed within brackets, for example: {1,2,3}. |
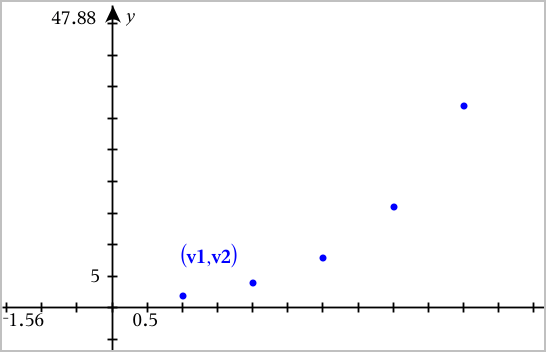
| 4. | Press Enter to plot the data, and then zoom the work area to view the plotted data. |