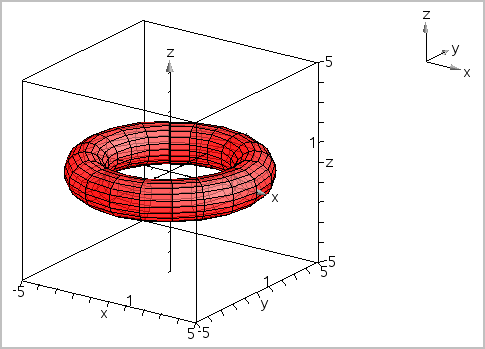
| 1. | In the 3D Graphing view, select 3D Graph Entry/Edit > Parametric. |
The entry line appears.

| 2. | Type the equations that define the graph. |

| 3. | Press Enter to draw the graph and hide the entry line and keyboard. You can show or hide the entry line anytime by pressing Ctrl+G. |

| 4. | To set the graphing parameters tmin, tmax, umin, and umax, display the graph's context menu, and select Edit Parameters. |
