The Graphs application lets you plot two types of sequences. Each type has a separate template for defining the sequence.
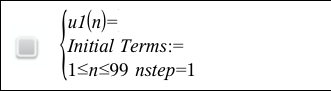
| 1. | From the Graph Entry/Edit menu, select Sequence > Sequence. |
| 2. | Type the expression to define the sequence. |
| 3. | Type an initial term. If the sequence expression references more than one prior term, such as u1(n‑1) and u1(n‑2), separate the terms with commas. |
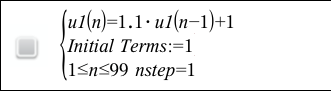
| 4. | Press Enter. |
A custom sequence plot shows the relationship between two sequences by plotting one on the x axis and the other on the y axis.
This example simulates the Predator-Prey model from biology.
| 1. | Use the relations shown here to define two sequences: one for a rabbit population, and another for a fox population. Replace the default sequence names with rabbit and fox. |
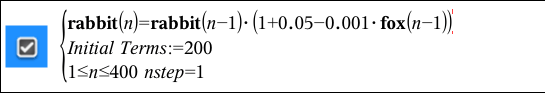
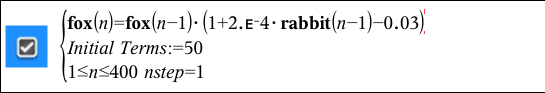
.05 = the growth rate of rabbits if there are no foxes
.001 = the rate at which foxes can kill rabbits
.0002 = the growth rate of foxes if there are rabbits
.03 = the death rate of foxes if there are no rabbits
Note: If you want to see the plots of the two sequences, zoom the window to the Zoom ‑ Fit setting.
| 2. | From the Graph Entry/Edit menu, select Sequence > Custom. |
| 3. | Specify the rabbit and fox sequences to plot on the x and y axes, respectively. |
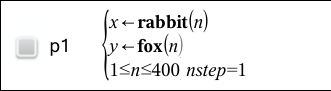
| 4. | Press Enter to create the custom plot. |
| 5. | Zoom the window to the Zoom ‑ Fit setting. |
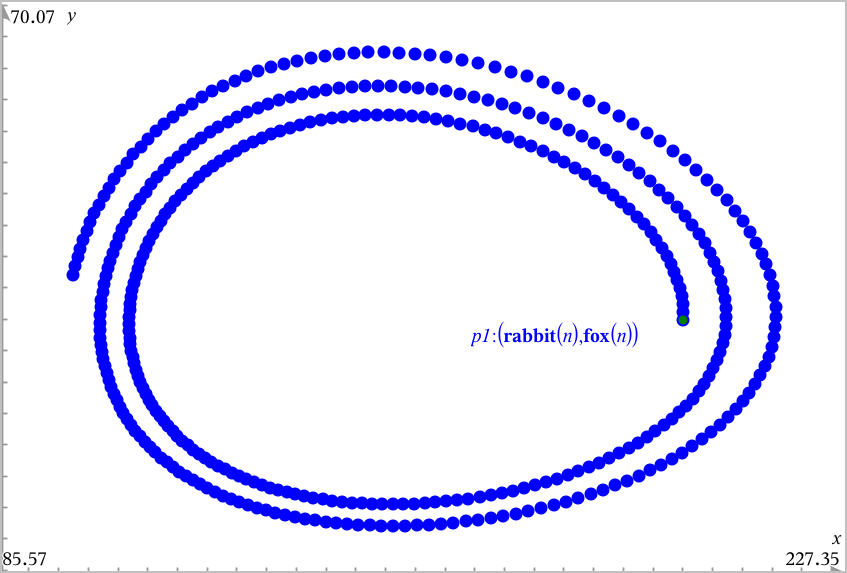
| 6. | Explore the custom plot by dragging the point that represents the initial term. |