You are here: Welcome to the TI‑Nspire™ App for iPad® > Graphs Application > Graphing a Scatter Plot
Graphing a Scatter Plot
| 1. | In the Graphs application, tap Tools  and go to Graph Entry/Edit > Scatter Plot. and go to Graph Entry/Edit > Scatter Plot. |
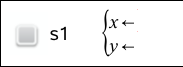
| 2. | Use one of the following methods to specify two lists to plot as x and y. |
| - | Tap  to select a list variable that you have defined in the current problem. to select a list variable that you have defined in the current problem. |
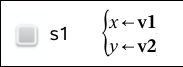
| - | Type the name of an existing list variable, such as v1. |
| - | Type the list elements directly (for example, type {1,2,3}. |
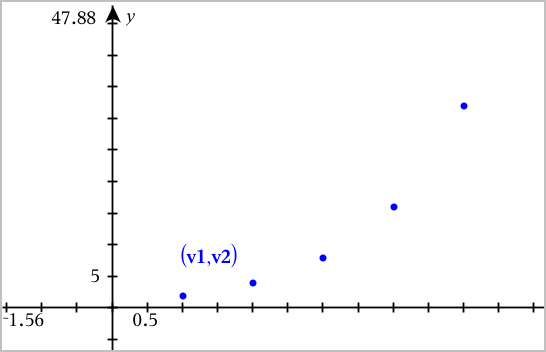
| 3. | Tap ENTER to plot the data, and then zoom the work area to view the plotted data. |