

Graphing Differential Equations
|
|
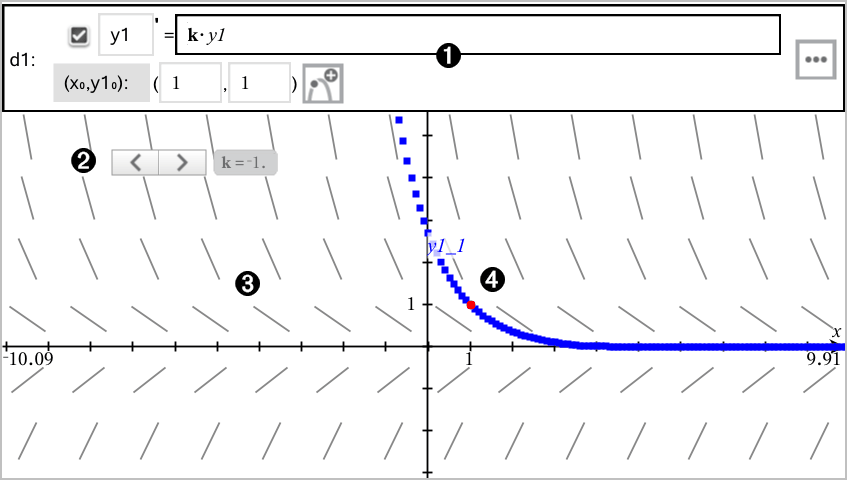
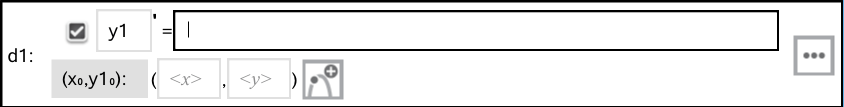
ODE entry line:
|
||||||||||||
|
|
Slider added for adjusting coefficient k of the ODE |
||||||||||||
|
|
Slope field |
||||||||||||
|
|
A solution curve passing through the initial condition |


To Graph a Differential Equation:
| 1. | In the Graphing view, tap Tools  and go to Graph Entry/Edit > Diff Eq. and go to Graph Entry/Edit > Diff Eq. |
The ODE is automatically assigned an identifier, such as “y1.”
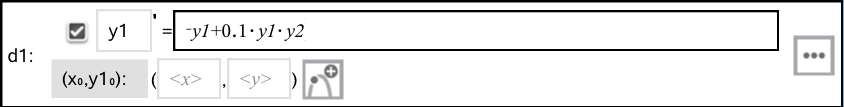
| 2. | Move to the relation field and enter the expression that defines the relation. For example, you might enter -y1+0.1*y1*y2. |
| 3. | Enter the initial condition for the independent value x0 and for y10. |
Note: The x0 value(s) are common to all the ODEs in a problem but can be entered or modified only in the first ODE.
| 4. | Tap Edit Parameters  to set the plot parameters. Select a numerical Solution Method, and then set any additional parameters. You can change these parameters anytime. to set the plot parameters. Select a numerical Solution Method, and then set any additional parameters. You can change these parameters anytime. |
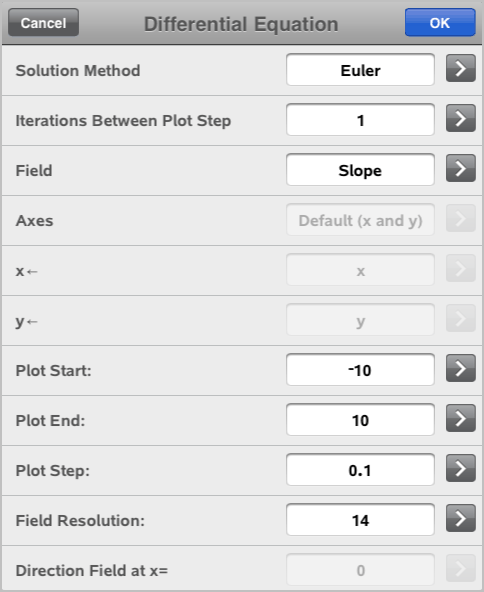
| 5. | Tap OK. |
| 6. | Zoom the window as necesssary to view the graph. |