Utilizar los siguientes programas de muestra para familiarizarse con los métodos de Python. También están disponibles en el archivo Getting Started Phyton.tns localizado en la carpeta Ejemplos.
Nota: Si copia y pega cualquier código de muestra que contenga indicadores de tabulador de sangría (••) en el software TI-Nspire™, deberá reemplazar esas instancias con las sangrías de tabulación reales.
Enlaces de temas
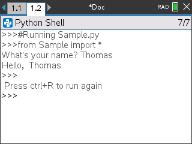
Hola
# This program asks for your name and uses
# it in an output message.
# Run the program here by typing "Ctrl R"
name=input("What's your name? ")
print("Hello, ", name)
print("\n Press ctrl+R to run again")
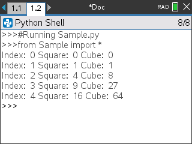
Ejemplo de bucle
# This program uses a "for" loop to calculate
# the squares and cubes of the first 5 numbers
# 0,1,2,3,4
# Note: Python starts counting at 0
for index in range(5):
••square = index**2
••cube = index**3
••print("Index: ", index, "Square: ", square,
••••"Cube: ", cube)
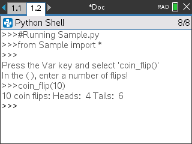
Cara o cruz
# Use random numbers to simulate a coin flip
# We will count the number of heads and tails
# Run the program here by typing "Ctrl R"
# Import all the functions of the "random" module
from random import *
# n is the number of times the die is rolled
def coin_flip(n):
••••heads = tails = 0
••for i in range(n):
# Generate a random integer - 0 or 1
# "0" means head, "1" means tails
••••side=randint(0,1)
••••if (side == 0):
••••••heads = heads + 1
••••else:
••••••tails = tails + 1
# Print the total number of heads and tails
••print(n, "coin flips: Heads: ", heads, "Tails: ", tails)
print("\nPress the Var key and select 'coin_flip()'")
print("In the ( ), enter a number of flips!")
Trazar
# Plotting example
import ti_plotlib as plt
# Set up the graph window
plt.window(-10,10,-10,10)
plt.axes("on")
plt.grid(1,1,"dashed")
# Add leading spaces to position the title
plt.title(" TITLE")
# Set the pen style and the graph color
plt.pen("medium","solid")
plt.color(28,242,221)
plt.line(-5,5,5,-5,"arrow")
plt.pen("thin","dashed")
plt.color(224,54,243)
plt.line(-5,-5,5,5,"")
# Scatter plot from 2 lists
plt.color(0,0,0)
xlist=[1,2,3,4,5]
ylist=[5,4,3,2,1]
plt.scatter(xlist,ylist, "x")

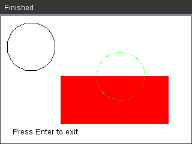
Dibujar
from ti_draw import *
# (0,0) is in top left corner of screen
# Let's draw some circles and squares
# Circle with center at (50,50) and radius 40
draw_circle(50,50,40)
# Set color to red (255,0,0) and fill a rectangle of
# of width 180, height 80 with top left corner at
# (100,100)
set_color(255,0,0)
fill_rect(100,100,180,80)
# Set color to green and pen style to "thin"
# and "dotted".
# Then, draw a circle with center at (200,100)
# and radius 40
set_color(0,255,0)
set_pen("thin","dotted")
draw_circle(200,100,40)
set_color(0,0,0)
draw_text(20,200,"Press Enter to exit")
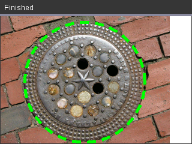
Image
# Image Processing
#================================
from ti_image import *
from ti_draw import *
#================================
# Load and show the 'manhole_cover' image
# It's in a Notes app
# Draw a circle on top
im1=load_image("manhole_cover")
im1.show_image(0,0)
set_color(0,255,0)
set_pen("thick","dashed")
draw_circle(140,110,100)
Hub
Este programa utiliza Python para controlar el TI-Innovator™ Hub, un microcontrolador programable. La ejecució del programa sin conectar un TI-Innovator™ Hub mostrará un mensaje de error.
Para obtener más información sobre TI-Innovator™ Hub, visite education.ti.com.
#========== Import Section ==========
from ti_hub import *
from math import *
from random import *
from time import sleep
from ti_plotlib import text_at,cls
from ti_system import get_key
#======== End of Import Section =======
print("Connect the TI-Innovator Hub and hit 'enter'")
input()
print("Blinking the RGB LED for 4 seconds")
# Set the RGB LED on the Hub to purple
color.rgb(255,0,255)
# Blink the LED 2 times a second for 4 seconds
color.blink(2,4)
sleep(5)
print("The brightness sensor reading is: ", brightness.measurement())
# Generate 10 random colors for the RGB LED
# Play a tone on the Hub based on the random
# color
print("Generate 10 random colors on the Hub & play a tone")
for i in range(10):
••r=randint(0,255)
••b=randint(0,255)
••g=randint(0,255)
••color.rgb(r,g,b)
••sound.tone((r+g+b)/3,1)
••sleep(1)
color.off()