Inserting a Background Image
You can insert an image as a background for any Graphs or Geometry page.
| 1. | From the Insert menu, click Image. |
| 2. | Navigate to the image you want to insert, select it and then click Open. |
Adding a Text Object to the Work Area
Use the Text tool to add numeric values, formulas, observations or other explanatory information to the Graphs work area. You can graph an equation entered as text (such as "x=3").
| 1. | From the Actions menu, select Text. |
| 2. | Click the location for the text. |
| 3. | Type the text in the box that appears, and then press Enter. |
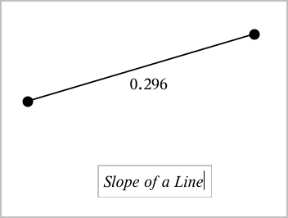
To move a text object, drag it. To edit the text, double-click it. To delete a text object, display its context menu, and select Delete.
Changing the Attributes of Numeric Text
If you enter a numeric value as text, you can lock it or set its format and displayed precision.
| 1. | From the Actions menu, select Attributes. |
| 2. | Click the numeric text to display its list of attributes. |
| 3. | Press ▲ and ▼ to move through the list. |
| 4. | At each attribute icon, press◄ or ► to move through the options. For example, select 0 through 9 as the precision. |
| 5. | Press Enter to apply the changes. |
| 6. | Press Esc to close the Attributes tool. |
Displaying the Grid
By default, the grid is not displayed. You can choose to display it as dots or lines.
| ▶ | From the View menu, select Grid, and then select Dot Grid, Lined Grid, or No Grid. |
Changing the Grid Colour
| 1. | From the Actions menu, choose Select > Grid (available only when the grid is displayed). |
The grid flashes to show it is selected.
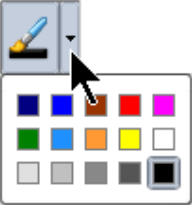
| 2. | Click the down arrow next to the Colour button, and select a colour for the grid. |
Changing the Appearance of the Graph Axes
| 1. | From the Actions menu, click Attributes. |
| 2. | Click either axis. |
| 3. | Press ▲ and ▼ to move to the desired attribute, and then press ◄ and ► to choose the option to apply. |
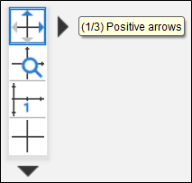
Note: To hide the axes or selectively hide or show an individual axis end-value, use the Hide/Show tool.
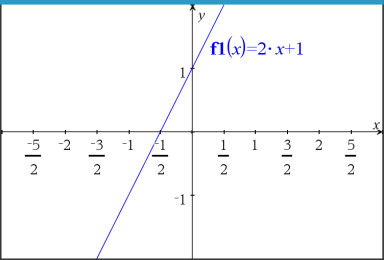
To display multiple tick mark labels, select the Multiple Labels option.
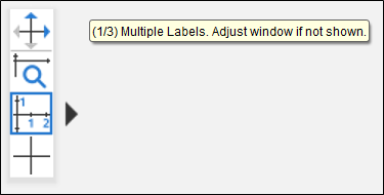
Multiple labels are only displayed if they fit both horizontally and vertically on the axes. If necessary, adjust the values in the Window / Zoom > Window Settings dialogue.
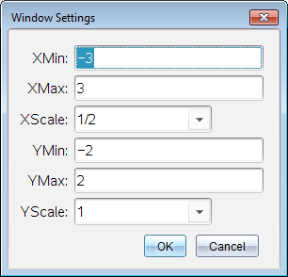
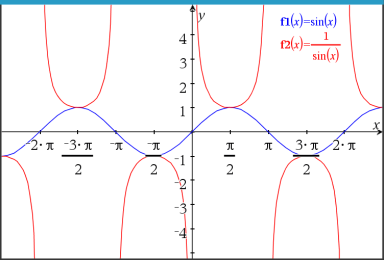
Exact Arithmetic and CAS Only: You can change the tick mark labels to display multiples of Pi, radical numbers, and other exact values by editing the XScale or YScale values in the Window / Zoom > Window Settings dialogue. See the following example.
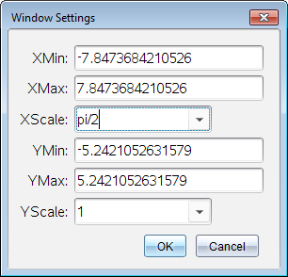
Note: pi/2 will be converted to p/2 after clicking OK.
Note: For information about path plots, see Exploring Graphs with Path Plot.