| 1. | In the Graphing view, tap Tools  and go to Graph Entry/Edit > Equation. and go to Graph Entry/Edit > Equation. |
| 2. | Tap the type of equation (Line, Parabola, Circle, Ellipse, Hyperbola or Conic). |
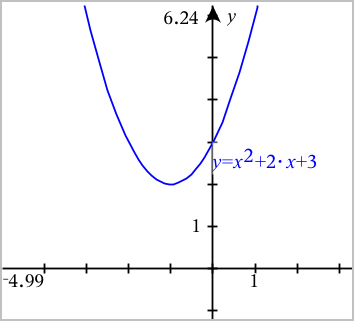
| 3. | Tap the specific template for the equation. For example, tap y=a•x2+b•x+c to define a parabola. |
The entry line includes a symbol to indicate the type of equation.
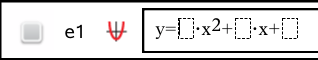
| 4. | Type the coefficients into the equation template. |
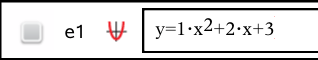
| 5. | Tap ENTER. |