Multiple labels are only displayed if they fit both horizontally and vertically on the axes. Rescale the Axes if necessary by pinching or spreading either the horizontal or vertical axis to modify its scale.
-OR
Drag either axis to shift the axis while retaining its scale.
To restore the original size and location of the plotted data, tap Tools > Window / Zoom > Zoom-Data.
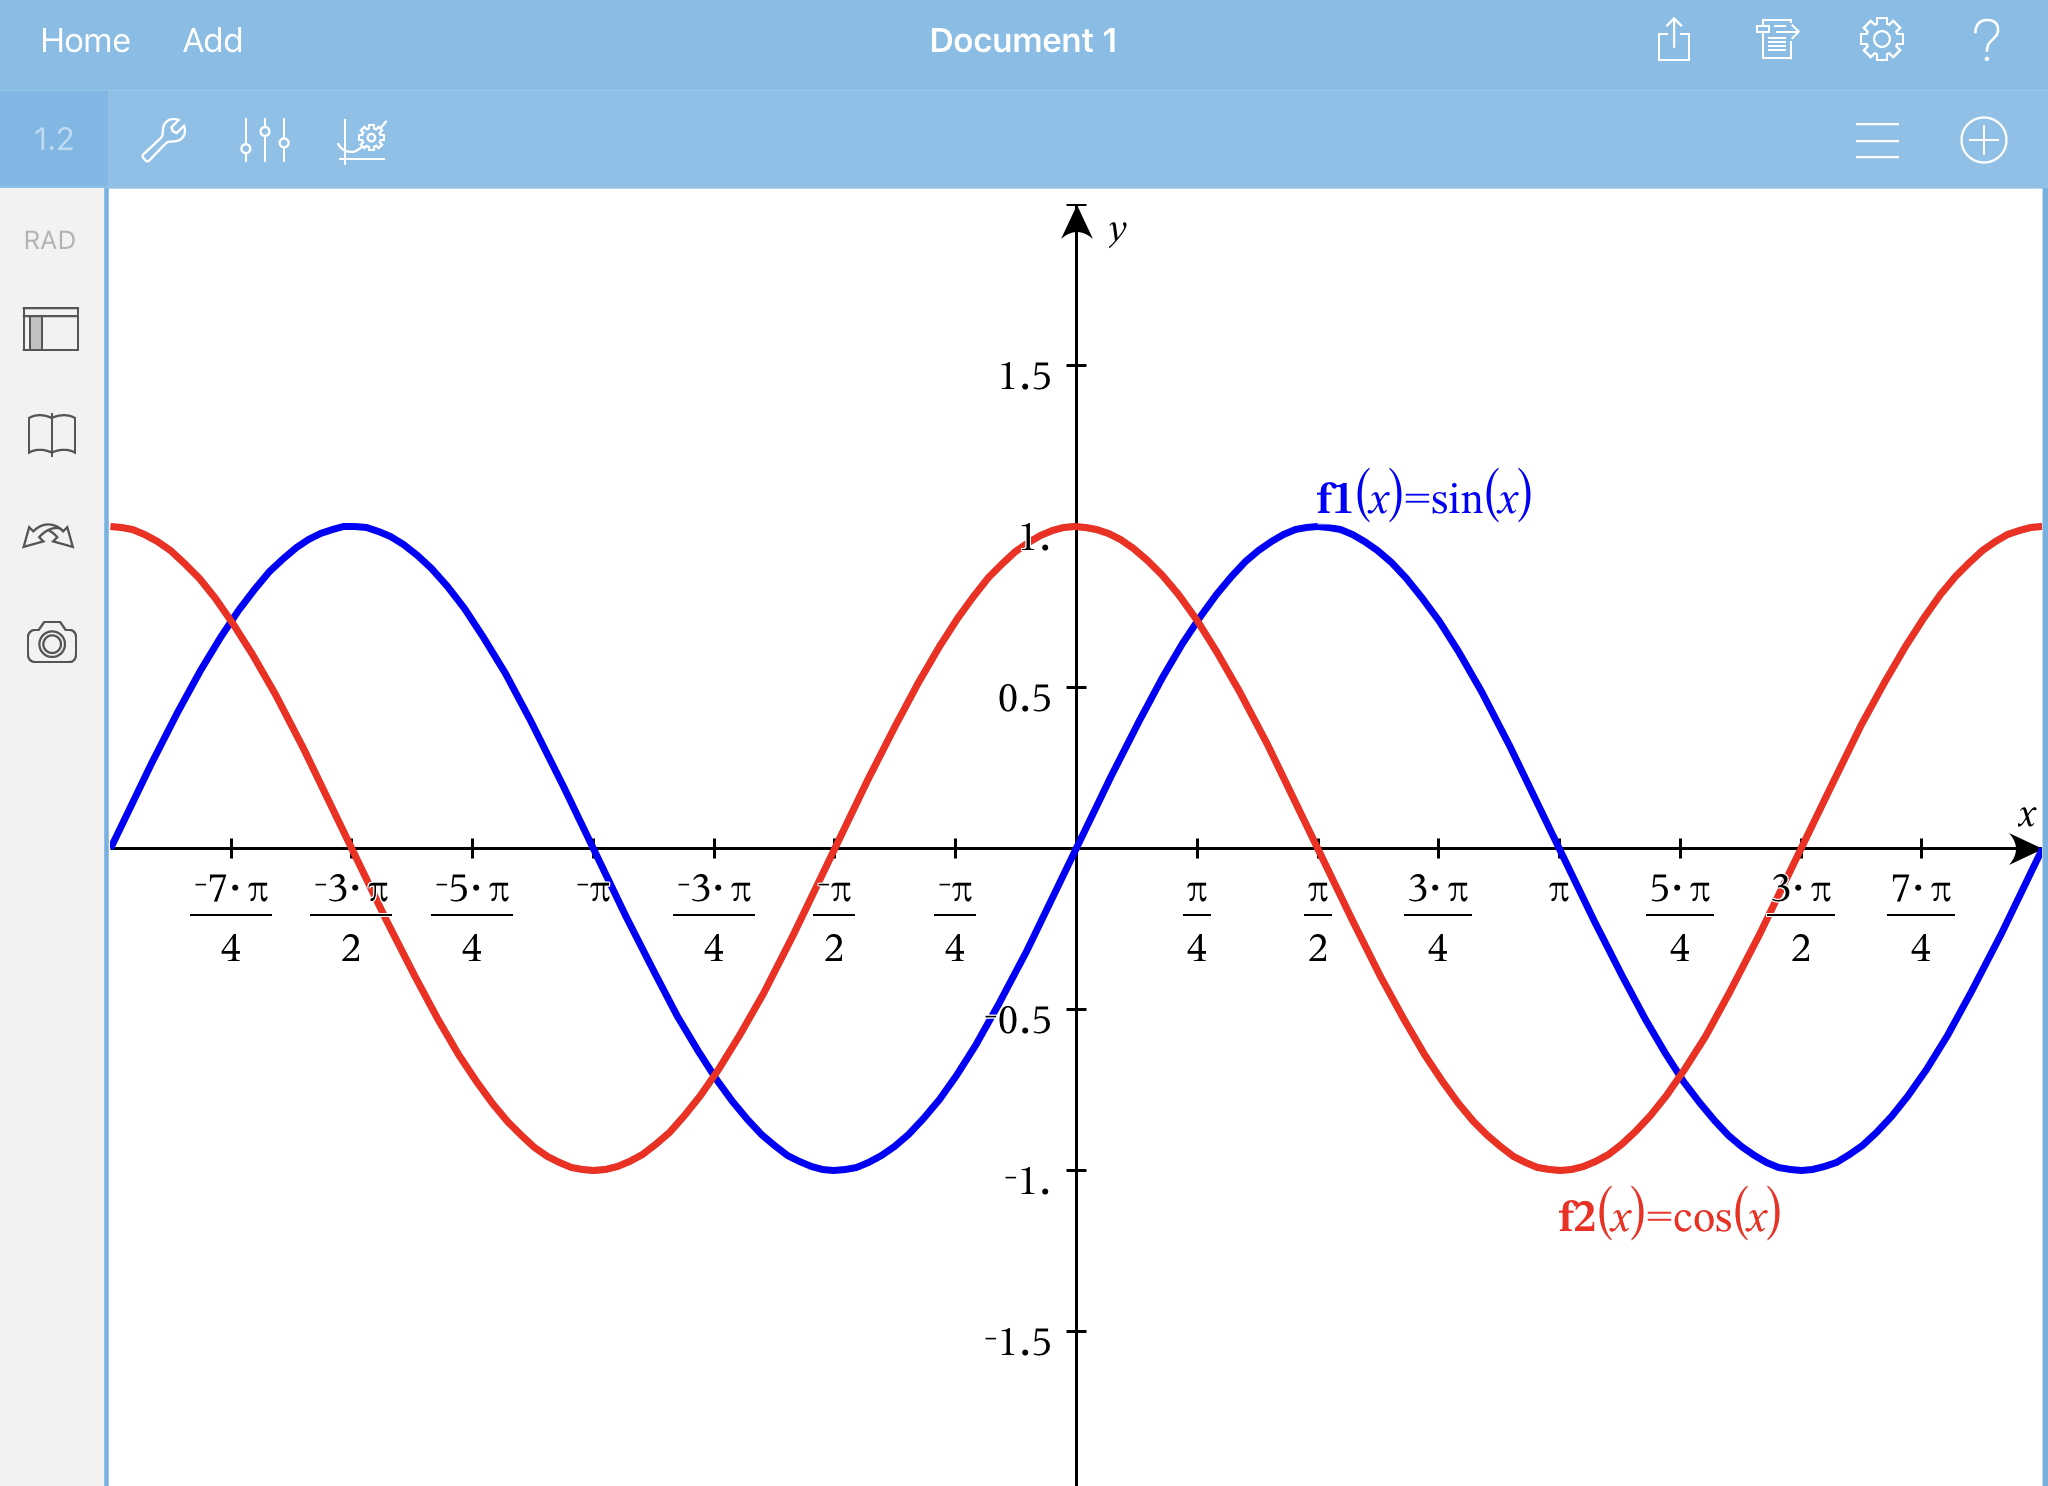
Exact Arithmetic and CAS Only: You can change the tick mark labels to display multiples of Pi, radical numbers, and other exact values by editing the XScale or YScale values in the .
Note: pi/2 will be converted to p/2 after clicking .
Note: For information about path plots, see Exploring Graphs with Path Plot.
 Zooming/Rescaling Manually
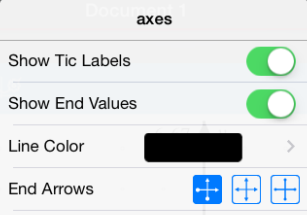
 , select
  to show a list of attributes that you can change.