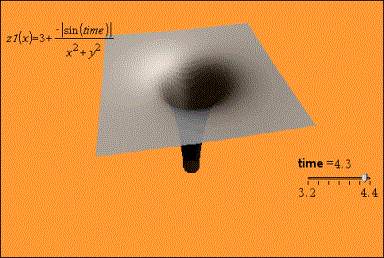
Example: Creating an Animated 3D Graph
|
1.
|
Insert a new problem and select the 3D Graphing view. |
|
2.
|
From the menu, select , click to position it, and type time as the variable name. |
|
3.
|
Display the slider’s context menu, click , and enter the following values. |
Value:
Minimum:
Maximum:
Step Size:
|
4.
|
In the entry line, define the function shown here: |

|
5.
|
Drag the slider thumb to see the effect of varying time. |

|
6.
|
Add visual interest. For example: |

|
7.
|
To animate the graph, display the slider’s context menu, and click . (To stop, click from the context menu.) |
You can combine manual or auto rotation with the slider animation. Experiment with the x and y resolution to balance curve definition against animation smoothness.


