This lesson investigates graphing implicit relations.
The expression x3 + y3 – 9xy = 0 implies a relation between x and y but the relation may not be obvious. A graph will help to illustrate the relation.
Graphing an Implicit Relation
The TI-89 can graph an implicit relation that has two variables x and y, but the Graph mode needs to be set properly.
Setting the Mode
-
Choose the 3D Graph mode by pressing

 and highlighting "5:3D"
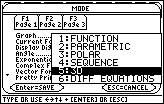
-
Select and save 3D graphing mode by pressing
 twice
twice
Entering the Relation
In FUNCTION graphing mode, you define a set of functions of the form y(x), such as y1, but in 3D Graph mode, each function has the form z(x, y). That is, z is a function of two variables x and y and the graph of the function is a surface in three-space. When the Graph mode is 3D the names of the functions shown in the Y= Editor are z1, z2, etc.
On the TI-89, an implicit relation is graphed by plotting all the points where z(x, y) = 0. The relation under consideration is x3 + y3 – 9xy = 0 , so let z = x3 + y3 – 9xy.
-
Open the Y= Editor by pressing


-
Set z1=x^3+y^3-9x·y
Be sure to use the multiplication operator between the x and y factors in the last term.
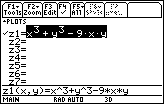
Setting the Graph Format
Have the calculator display the axes, which are probably turned off in the 3D graphing mode.
-
Open the GRAPH FORMATS dialog box by pressing


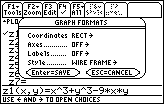
-
Open the Axes options by moving the cursor to the line labeled "Axes" and pressing

-
Highlight "2:AXES" by pressing

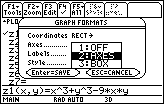
-
Select option 2:AXES by pressing

Do not exit the Graph Formats dialog box.
Selecting Implicit Plot Style
-
Display the Style options by moving the cursor to the line labeled "Style" and pressing

- Highlight "5:IMPLICIT PLOT"

-
Select 5:IMPLICIT PLOT by pressing

-
Exit the Graph Formats dialog box by pressing

Setting the Viewing Cube Values
For 3D graphs the Viewing Window is called the Viewing Cube, and it is defined by the values of xmin, xmax, ymin, ymax, zmin, and zmax. The viewing angle is determined by the three components shown below.
eye![]() is the angle in the x y - plane from the positive x-axis.
is the angle in the x y - plane from the positive x-axis.
eye![]() is the angle from the positive z-axis.
is the angle from the positive z-axis.
eye![]() is the angle by which the graph is rotated counterclockwise around the line of sight set by eye
is the angle by which the graph is rotated counterclockwise around the line of sight set by eye![]() and eye
and eye![]() .
.
The three viewing angle components are always entered as DEGREE measures regardless of the currently selected Angle mode.
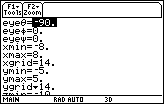
Setting the three viewing angle components as shown below displays the graph of the implicit relation as seen from above the xy - plane with the x- and y- axis in the standard orientation on the screen. Whenever one changes into IMPLICIT PLOT mode, the three viewing angles are set to these values automatically.
- Set the Viewing Cube to the following values:
|
eye |
xmin = –8 | ymin = –5 | zmin = –10 | ||||||||||
|
eye |
xmax = 8 | ymax = 5 | zmax = 10 | ||||||||||
|
eye |
xgrid = 14 | ygrid = 14 |
|
||||||||||
-
Display the graph by pressing


Be patient. It will take a minute or two for the graph to appear.
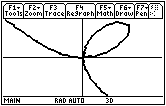
|
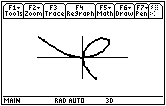
|
| Normal View | Expanded View |
This graph is called a folium. It dates to Descartes in 1638.
|
|||
|
|
|||
13.1.1 Find the points on the graph of x3 + y3 – 9xy = 0 when x = 4 by using the solve command.
Click here for the answer.