A related-rate problem that models two ships as they move away from each other is discussed in this lesson.
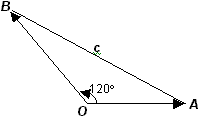
Two ships start at a point O and move away from that point along routes that make a 120° angle. Ship A moves at 14
knots and Ship B moves at 21 knots. In the diagram below A represents the position of Ship A, B represents the position of Ship B, and c represents the distance between the ships.
![]()
![]()
A knot is a unit used to measure the speed of a ship. One knot represents one nautical mile (6,076.1 feet) an hour.
![]()
![]()
Modeling the Positions of the Ships
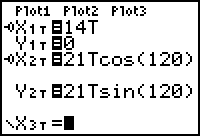
Suppose that the point O is the origin and that Ship A is moving along the positive x-axis at 14 knots. Enter the parametric equations for Ship A's position at time t hours.
- Set X1T = 14T
- Set Y1T = 0
Parametric equations can be used to model the position of an object at time t that is moving away from the origin at speed v along a line that forms an angle
![]() with the positive x-axis. Such equations have the form
with the positive x-axis. Such equations have the form
x = (v cos(![]() ))t
))t
y = (v sin(![]() ))t
))t
Enter the equations for Ship B's position, which is moving at 21 knots along a line that forms a 120° angle with the path of Ship A.
- Select Degree in the MODE settings.
- Set X2T = 21T*cos(120).
- Set Y2T = 21T*sin(120).
-
Change the Graph Style of both sets of equations to Path (
 ).
).
- Make sure the Graph order in the MODE settings is still Simultaneous.
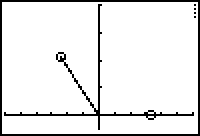
- Graph the equations in a [0, 6, 0.1] x [-150, 150, 25] x [-25, 200, 50] window.
Finding the Distance between the Ships
The position of the Ship A is given by the point (X1T, Y1T) and the position of Ship B is given by (X2T, Y2T). The distance between the ships can be found using the distance formula:
We plan to graph the distance between the ships versus time, and that's why we want to set X3T = T.
- Define X3T = T.
-
Define
 .
.
- Unselect both X1T and X2T.
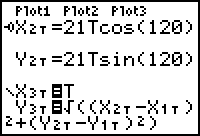
- Display the graph of the distance function versus time (X3T, Y3T) in a [0, 6, 0.1] x [0, 6, 1] x [-25, 200, 50] window.
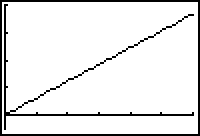
Notice that the distance function appears to be linear.
16.3.1 Approximate the distance between the ships after two hours by using the Trace feature. Click here for the answer.
Finding the Speed at which the Ships are Moving Apart
The speed at which the ships are moving apart can be determined by finding the derivative of the distance function with respect to t.
- Enter X4T = T
- Enter Y4T = nDeriv(Y3T,T,T)
- Graph the distance function with its derivative in the previous window.
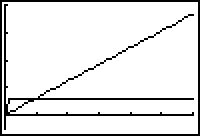
The "funny" part of the velocity graph near zero is an error due to using nDeriv and a "visible" step size.
Notice that the speed at which the ships are moving apart is constant, as indicated by the horizontal line.
16.3.2 Approximately how fast are the ships moving apart? Click here for the answer.
Modifying the Problem
Assume that both ships travel in the same direction and at the same speed as before, but Ship A begins its journey 5 nautical miles from point O and Ship B begins 3 nautical miles from point O. Modify the parametric equation to reflect these changes.
-
Enter the following:
X1T = 14T + 5
Y1T = 0X2T= (21T+3)*cos(120)
Y2T= (21T+3)*sin(120)
The equations defined as the third and fourth sets of parametric equations, which represent the distance between the ships and the rate at which that distance is changing, were written using the first and second sets of equations, so they do not need to be changed.
16.3.3 How far apart are the ships after 2 hours? How fast are the ships moving apart? Compare the new rate with the rate when the ships started at the same place. Click here for the answer.