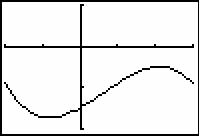
In this lesson you will use the tanimate program and the Numeric Derivative feature in the Math menu to determine characteristics of a function by looking at the graph of its second derivative.
The Second Derivative
If f is a function, then its derivative, f ', is also a function. As a function itself, f ' may have its own derivative. The derivative of f ' is called the second derivative of f.
The second derivative of the function f is denoted by f ", which is read "f double prime."
Visualizing How the Tangent Line Slopes Change
Visualize the relationship between a function and its second derivative by running tanimate and watching the creation of tangent lines with a new focus.
- Graph y = -x3 + 2x2 + 5x - 15 in a [-2, 3, 1] x [-20, 10, 10] window with Xres=2.

If a curve is not linear, the slopes of the tangent lines change from one point to the next. How the slopes change relates to the concavity of the function, which is determined by whether the graph is turning upward or downward. The final graph produced by tanimate does not illustrate this concept, but watching the dynamic display of how the slopes of the animated tangent lines change illustrates the relationship.
Run the program tanimate again and watch the tangent lines. Pay special attention to how the slopes of the tangent lines are changing from one point to the next. Are the slopes increasing or decreasing? When do they change from increasing to decreasing?
-
Run the TI-83 program tanimate by pressing
 , select TANIMATE from the list of programs, and press
 once the program command is pasted to the Home Screen.
- Select "2:DYNAMIC" in the first menu.
- Select "2:MEDIUM" in the second menu.
- Select "2:TANGENT/POINTS" in the third menu.
The graph will be redrawn after the last step. Now set the left and right endpoints and run the program.
-
Move the cursor to X = -1.8 and press
 to select the left endpoint.
-
Move the cursor to X = 2.5 and press
 to select the right endpoint.
11.2.1 Describe how the slopes of the tangent lines change between x = -1.8 and x = 2.5. Click here for the answer.
It may be hard to tell exactly where the slopes change from increasing to decreasing, but there are other ways to determine this.
-
Exit the program by pressing
 and selecting 6:QUIT.
Concavity
The graph of a function is said to be concave upward on an interval where the slopes of the tangent lines increase and concave downward where the slopes of the tangent lines decrease. That is, the curve is turning upward when the slopes are increasing and turning downward when the slopes are decreasing.
11.2.2 Approximate where the graph of y = -x3 + 2x2 + 5x - 15, shown above, changes from concave upward to concave downward by using the Trace feature of the Graph screen. Click here for the answer.
Concavity of a Function from the Graph of Its Second Derivative
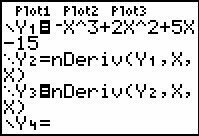
The graph of the second derivative of y = -x3 + 2x2 + 5x - 15 can be found by using the Numerical Derivative feature in the Y= editor a second time.
- Enter Y2 = nDeriv(Y1, X, X), if necessary.
-
Unselect Y2 by moving the cursor onto "=" beside Y2 using the left arrow key and then pressing
 .
.
The derivative of the first derivative is the second derivative of the function, and it can be graphed by using the command below.
- Enter Y3 = nDeriv(Y2,X,X) and set its style to "dot."

-
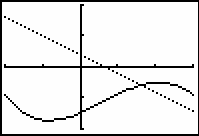
Graph Y1 and Y3 in a [-2, 3, 1] x [-20, 10, 10] window with Xres = 2.
The dotted line in the graph below is the approximate second derivative of the function.

11.2.3 What is the relationship between the second derivative and the original function? Click here for the answer.
Finding an Inflection Point
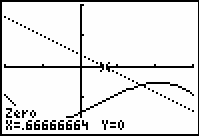
A point where a function's graph changes concavity is called an inflection point. Since the sign of the second derivative must change at such a point, you can find the x-coordinate of the point by finding the corresponding zero of the second derivative.
- Return to the graph and select "2:zero" from the CALCULATE menu.
-
Move the cursor to the graph of the second derivative by pressing
 .
.
- Mark the left and right bounds and indicate an initial guess.

The second derivative has a zero at x
![]() 2/3, so the point of inflection of the function y = -x3 + 2x2 + 5x - 15 occurs there as well.
2/3, so the point of inflection of the function y = -x3 + 2x2 + 5x - 15 occurs there as well.
Finding the Inflection Point of Another Function
Find the inflection point of the function
![]() .
.
-
Graph
 and its second derivative in a [-4.7, 4.7, 1] x [-5, 5,1] window with Xres=2.
- Find the zero of the second derivative.
|
|||
|
|
|||
11.2.4 What is the x-coordinate of the inflection point? Click here for the answer.