In Lesson 9.1 you found average velocities of a falling book over different time intervals. In this lesson you will find the instantaneous velocity of the falling book at t = 0.16.
In Lesson 9.1 the average velocity of the book from t = 0 to t = 0.16 was found to be approximately -0.931 m/s and the average velocity of the book from t = 0.16 to t = 0.28 was found to be approximately -2.183 m/s.
Instantaneous velocity is the velocity of an object at a specific instant, which is the number that would be read from a speedometer at that particular moment. Each of the average velocities previously found could be considered an approximation of the instantaneous velocity at t = 0.16, but neither was exact.
Getting Better Approximations
You can use average velocities to find a series of approximations that will lead to the instantaneous velocity of an object at a given instant by letting the elapsed time between measurements be very small.
9.2.1 Find the average velocities over shorter and shorter intervals near t = 0.16 by using the following data points. Click here for the answer.
| Data Points | Average Velocity |
| (0.16, 0.716) to (0.26, 0.506) | |
| (0.16, 0.716) to (0.22, 0.600) | |
| (0.16, 0.716) to (0.18, 0.681) |
9.2.2 Which of the three average velocities is the best approximation to the instantaneous velocity? Why? Click here for the answer.
Fitting a Curve to the Data
The smaller the elapsed time interval, the better the average velocity approximates the instantaneous velocity. The smallest time interval provided by the data near t = 0.16 has length 0.02. However, a regression equation that approximates the data can be used to obtain points even closer to t = 0.16 and those points can then be used to find a better approximation of the book's instantaneous velocity at t = 0.16.
The shape of the data appears to be parabolic, so a quadratic equation should fit the data.
-
Open the Stat Calc menu by pressing

 .
.
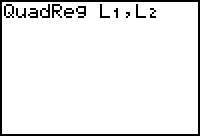
- Choose quadratic regression by selecting 5:QuadReg.
- Complete the command by entering QuadReg L1, L2.
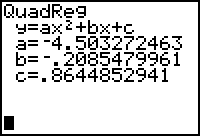
Notice the third parameter (Y1) for the regression command is missing and that the calculator will not store the regression equation in the Y= editor. You will round off the coefficients of the regression equation and manually enter the rounded version in the Y= editor.
|
|
| Regression command |
The regression equation is y |
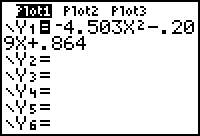
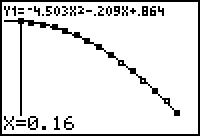
- Enter Y1 = -4.503X2 - 0.209X + 0.864 in the Y= editor.
-
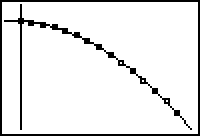
Display the regression equation with the scatter plot by pressing
 .
.
Using the Regression Equation
The height of the book at t = 0.16 and t = 0.18 can now be approximated by finding Y1(0.16) and Y1(0.18). These values can be used to approximate the average velocity of the book between t = 0.16 and t = 0.18 by computing
-
Enter the command (Y1(0.18)-Y1(0.16))/(0.18-0.16) on the Home screen.
Y1 can be pasted to the Home screen by pressing
 .
.
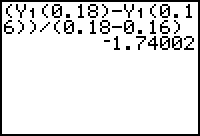
The result is a good approximation of the average velocity of -1.75 m/s you found using the table data values over the same interval in Question 9.2.1.
Better Approximations
Points even closer to (0.16, 0.716), which represent shorter time intervals, may be found by using the quadratic function stored in Y1.
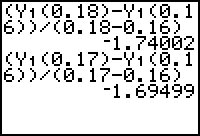
Find the average velocity for the interval from t = 0.16 and t = 0.17 by evaluating
Instead of pressing all the keys to enter the above expression, recall and edit the last command on the Home screen.
-
Recall the last command by pressing
 [ENTRY].
[ENTRY] is above .
.
-
Use the arrow keys to move the cursor until it is on the "8" in Y1(0.18) and change it to a "7" by pressing
 .
.
- Move the cursor to the "8" in the denominator and change it to a "7."
-
Evaluate the edited expression by pressing
.
|
|||
|
|
|||
9.2.3 Using the regression equation in Y1 and the method described above, find the average velocities for the smaller and smaller time intervals shown below.
t = 0.16 to t = 0.161 (elapsed time = 0.001 seconds)
t = 0.16 to t = 0.1601 (elapsed time = 0.0001 seconds)
t = 0.16 to t = 0.16001 (elapsed time = 0.00001 seconds)
Click here for the answer.
Finding Instantaneous Velocity
As the elapsed time approaches zero, the average velocities approach a limiting value. This limit is the instantaneous velocity and it can be found by letting h represent the elapsed time and evaluating
The three average velocities found in Question 9.2.3 could also be found by letting h = 0.001, 0.0001, and 0.00001
and evaluating
![]() .
.
Evaluating
![]() for smaller and smaller values of h gives an approximation for
for smaller and smaller values of h gives an approximation for
![]() , the instantaneous velocity at t = 0.16.
, the instantaneous velocity at t = 0.16.
Finding the Exact Value of the Limit
In order to find the exact value of the limit, the expression
![]() must first be simplified, as shown below. Recall that Y1 = -4.503x2 - 0.209x + 0.864.
must first be simplified, as shown below. Recall that Y1 = -4.503x2 - 0.209x + 0.864.
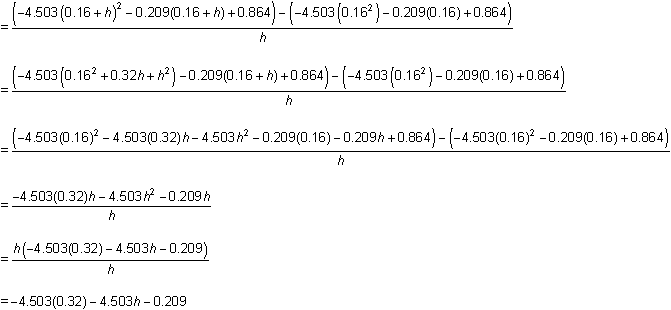
The limit of the last expression as h approaches 0 is -4.503(0.32) - 0.209 = -1.64996, so the instantaneous velocity at t = 0.16 is approximately -1.64996 m/s.
Illustrating Instantaneous Velocity
Just as the slope of the line that connects two points on the graph of height vs. time represents the average velocity between the two points, a special line is associated with the instantaneous velocity: the tangent line to the curve at the desired point.
The slope of the tangent line to a curve at a given point is defined the same way as instantaneous velocity.
Definition of a Tangent Line to a Curve
The tangent line to the graph of f at the point (a, f(a)) is the line through (a, f(a)) with slope
provided the limit exists.
Drawing a Tangent Line
A tangent line to a curve at a given point can be drawn with the Tangent feature, which is found in the Draw menu.
-
Return to the Graph screen by pressing
.
-
Open the Draw menu by pressing
[DRAW].

- Select 5:Tangent(.
-
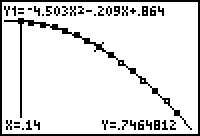
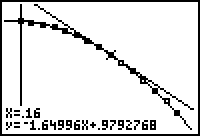
Enter the x-coordinate of the point of tangency, 0.16, and press
.
|
|
| Enter the x-value of the desired point. | Instantaneous velocity illustrated |
The equation at the bottom of the last screen, y = -1.64996x + 0.9792768 , is the equation of the line tangent to the curve at the point t = 0.16. Notice that the slope of this line, -1.64996, is equal to the instantaneous velocity found earlier by evaluating the limit
|
|||
|
|
|||