In previous modules you used the definite integral to find the area bounded by a function and the x-axis. In each case the graph of the function was above the x-axis. In this lesson you will see what happens when the function dips below the x-axis. You will also investigate the concept of the definite integral as a net area function.
All the curves explored in Module 16 were above the x-axis and the net area functions were always positive and increasing. The following investigates a definite integral when part of the curve is below the x-axis.
-
Graph y = sin x in a [0, 2
 ] x [-1, 1] window
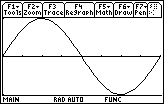
-
Evaluate the integral
 by using the integral key
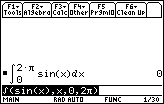
How can the result be zero? The area bounded by y = sin x and the x-axis certainly is not zero. To help answer this question, break the interval of integration into two subintervals that represent the areas above and below the x-axis: (0,
![]() ) and (
) and (
![]() , 2
, 2
![]() ).
).
-
Evaluate
 and
and

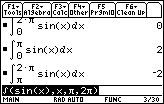
Finding Positive and Negative Integrals
Review the graph of y = sin x and the values of the definite integrals
![]() and
and
![]() .
.
|
|||
|
|
|||


The graph from 0 to
![]() is above the x-axis and the corresponding definite integral is positive.
is above the x-axis and the corresponding definite integral is positive.
The graph from
![]() to 2
to 2
![]() is below the x-axis and the corresponding definite integral is negative.
is below the x-axis and the corresponding definite integral is negative.
Finding Net Area
The definite integral
![]() represents the value of the net area, or the area above the x-axis minus the area below the x-axis. The net area between the curve y = sin x and the x-axis is zero because it is the sum of 2, the area above the axis, and –2, the negative of the area below the axis.
represents the value of the net area, or the area above the x-axis minus the area below the x-axis. The net area between the curve y = sin x and the x-axis is zero because it is the sum of 2, the area above the axis, and –2, the negative of the area below the axis.
![]()
17.1.1 Use the definite integral feature in the F5:Math menu of the Graph screen to approximate the values of
![]()
Click here for the answer.
Visualizing
![]()
You may obtain the general shape of a corresponding net area function on the interval [0, 2
![]() ] by examining the graph of y = sin x.
] by examining the graph of y = sin x.
-
Refresh the graph of y = sin x by pressing


The following characteristics of the net area function
![]() can be determined from the graph of the curve y = sin x. Look at the graph while reading the tables below.
can be determined from the graph of the curve y = sin x. Look at the graph while reading the tables below.
| Interval | Curve Function | Area Function |
|
|
increasing | concave upward |
|
|
decreasing | concave downward |
Using the fact that
the value of the curve function is the derivative of the net area function,
the x-values of maximums, minimums and points of inflection can be identified by examining how the curve is changing.
| x-value | Curve Function is Changing | Area Function |
|
x =
|
from positive to negative | maximum |
|
|
from increasing to decreasing | point of inflection |
|
|
from decreasing to increasing | point of inflection |
Other characteristics of the net area function include:
- The net area when x = 0 is 0.
-
The net area on the interval [0,
 ] is 2 and the net area function begins to decrease at that point, so the maximum of the net area function is 2 when x =
 .
.
-
The net area on the interval [0, 2
 ] is 0, so the net area function is 0 when x = 2
 .
.
With these characteristics you can draw a graph of the net area function
![]() , as shown below together with the graph of the curve.
, as shown below together with the graph of the curve.

|
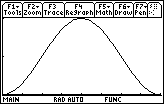
|
| y = sin x |
|
Visualizing the general shape of the integral function
![]() is often very helpful.
is often very helpful.
Extending the Procedure to Other Curves
17.1.2 Graph the curve and find the net area bounded by y = x3 – 3x2 – x + 3 and the x-axis on the interval [0, 4].
Click here for the answer.
Visualizing
![]()
The characteristics of the net area function
![]() can be found by examining the graph of the curve function. The graph of the curve is shown below in a [0, 4] x [ -5, 15] window with a list of the net area function's characteristics.
can be found by examining the graph of the curve function. The graph of the curve is shown below in a [0, 4] x [ -5, 15] window with a list of the net area function's characteristics.
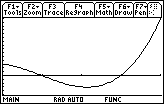
y = x3 – 3x2 – x + 3 |
|
The graphs of the curve function and the net area function are shown below for comparison.
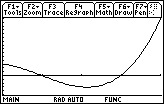
|
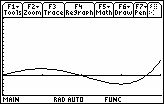
|
| y = x3 – 3x2 – x + 3 |
|
17.1.3 Approximate the graph of a net area function that corresponds to the following curve from 0 to 4.
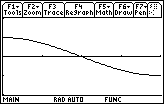
Click here for the answer.