This lesson investigates finding the definite integral, a basic construct of calculus, using the TI-83.
For a given function over a given x-interval, the limit of the Riemann sum as the number of rectangles approaches infinity is called a definite integral. The notation used to represent a definite integral is
![]() . If a < b and f(x) is non-negative on the interval [a, b], the integral represents the exact area under the curve y = f(x) above the x-axis between x = a and x = b. The values of a and b are called the limits of integration.
. If a < b and f(x) is non-negative on the interval [a, b], the integral represents the exact area under the curve y = f(x) above the x-axis between x = a and x = b. The values of a and b are called the limits of integration.
There are two features on the TI-83 that approximate a definite integral:
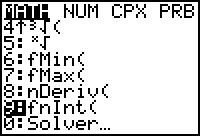
- fnInt, which is found in the Math menu.
-
 , which is found in the Graph screen's CALC menu.
Both do the same thing and will always give the same answer.
Using the fnInt Command
The area under the curve f(x) = x2 above the x-axis between x = 0 and x = 1 is given by
![]() . Use the fnInt command on the Home screen to approximate this integral by following the procedure below.
. Use the fnInt command on the Home screen to approximate this integral by following the procedure below.
- Go to the Home screen.
-
Clear the Home Screen by pressing

-
Paste the Definite Integral command (fnInt) to the Home screen by pressing
 and selecting 9:fnInt(.
|
|||
|
|
|||
- Complete the command fnInt(X2,X,0,1).
-
Execute the command by pressing
 .
.
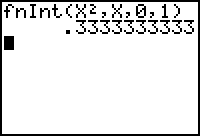
The exact value is 1/3. The fnInt command gives an approximation, and one cannot always count on it being all that accurate. However, for "typical" functions on reasonably sized intervals, it will be.
17.3.1 Approximate
![]() using the fnInt command and interpret the result.
using the fnInt command and interpret the result.
Click here for the answer.
Using the Graphical Definite Integral
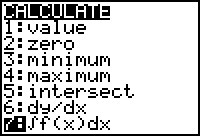
Another way to evaluate a definite integral is by graphing the function and using the Definite Integral function,
![]() , which is found in the CALC menu of the Graph screen.
, which is found in the CALC menu of the Graph screen.
- Graph Y1 = X2 in the window [-0.5, 1.5, 1] x [-0.5, 2, 1].
|
|||
|
|
|||
-
Select 7:
 from the CALC menu.
- When prompted, enter 0 for the lower limit and 1 for the upper limit.
|
|||
|
|
|||
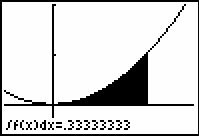
The Definite Integral command of the Graph screen's CALC menu shades the area and gives a decimal approximation of the integral.
17.3.2 Find the area under the curve g(x) = 2x + 1 between x = 0 and x = 3 by using the Definite Integral command in the CALC menu of the Graph screen. Use the window [0, 3, 1] x [-2, 10, 1].
Click here for the answer.