TI-Nspire™ Featured Activities Archive for High School
| Topic |
|---|
-
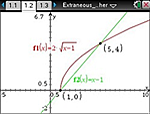
Extraneous Solutions
Students will discover solutions of radical equations and investigate extraneous solutions. Students will find a solution algebraically and use technology to graphically find them.
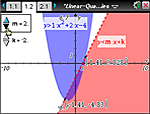
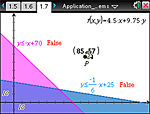
Linear-Quadratic Inequalities
Students will use sliders to control the intersection of a quadratic and a linear inequality.
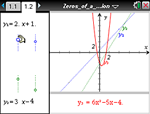
Zeros of a Quadratic Function
Students will use sliders to change the linear factors of a quadratic function. Students will connect the zeros of the quadratic function to the zeroes of the linear factors.
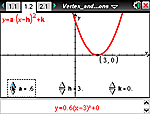
Vertex and Factored Forms of the Quadratic Function
Students will be able to identify and justify the effect of changing the parameters of a quadratic function in vertex form and factored form.
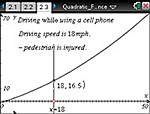
Quadratic Functions and Stopping Distance
Students will analyze and compare data for stopping distances for 3 conditions: normal conditions, talking on a cell phone, and a wet road.
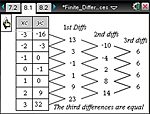
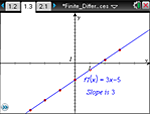
Finite Differences
Students will investigate into the set of differences for linear, quadratic, and cubic functions.
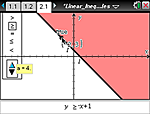
Linear Inequalities in two Variables
Students will discover the basics of graphing a linear inequality.
Applications of Linear Systems
Students will use a system of linear inequalities to solve a problem a real world problem about parking cars and buses.
Solving Systems by Graphing
Students will compare a linear and an exponential relationship using both a spreadsheet and scatter plots.
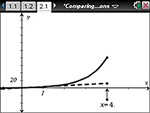
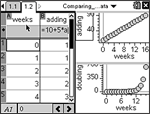
Comparing Linear and Exponential Functions
Students will compare a linear and an exponential relationship using both a spreadsheet and scatter plots.
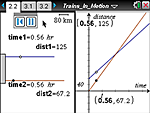
Trains in Motion
Students will visualize a solution to a system of equations and will explore a system that intersects in one point and identify the ordered pair that represents the solution.

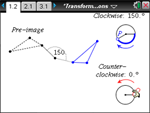
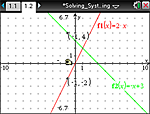
How Many Solutions to the System?
Students will translate and rotate a line to visualize that a system of equations can have a unique solution, infinitely many solutions, or no solution.

Multiple Representations
Students will explore information represented in tables, graphs, and symbols to interpret the meaning of slope and intercepts in the context of a real world situation.

Domain and Range
This lesson involves identifying a set of x-values in both symbols and words, identifying the set of x-values used in generating the function as the domain of the function, and identifying the set of y-values used in generating the function as the range of the function.
Finite Differences
Students will investigate inot the set of differences for linear, quadratic and cubic functions.
Comparing Linear and Exponential Functions
Students will compare a linear and an exponential relationship using both a spreadsheet and scatter plots.
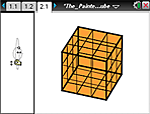
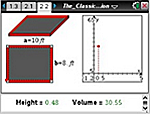
The Painted Cube
Students will model numerical data obtained from an application problem using linear, quadratic and cubic functions.
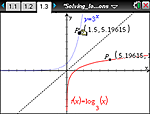
Solving Logarithmic Equations
Students will explore numeric, graphic, and symbolic approaches to solving logarithmic equations.
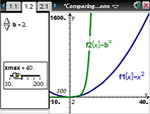
Comparing Exponential and Power Functions
Students will develop and test conjectures about the relative size and growth of power functions and exponential functions using graphical representations.
Comparing Linear and Exponential Data
Students will use a table and a graph to compare the changes in linear and exponential expressions as x is increases.
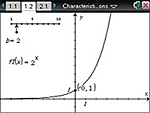
Characteristics of Exponential Functions
Students will investigate how the graph of an exponential function changes when 0 < b < 1, b = 1, or b > 1.
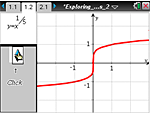
Exploring Power Functions 2
Students investigate power functions with a slider to discover the connection among power functions and radical and rational functions.

Exploring Polynomials: Factors, Roots, and Zeros
This lesson merges graphical and algebraic representations of a polynomial function and its linear factors.

Domain and Range 2
Students will explore discrete and continuous relations to identify and express the domain and range.

Families of Functions
This lesson involves changing the values for a, h and k and observing the effects on the graphs. The types of functions include quadratic, absolute value, exponential, logarithm, cubic and sine functions.