Using the Text Tool to Graph Equations
You can graph an "x=" or "y=" equation by typing it into a text box and dragging the text to an axis. You can edit the equation text (for example, change it to an inequality), but you cannot change it between x= and y=.
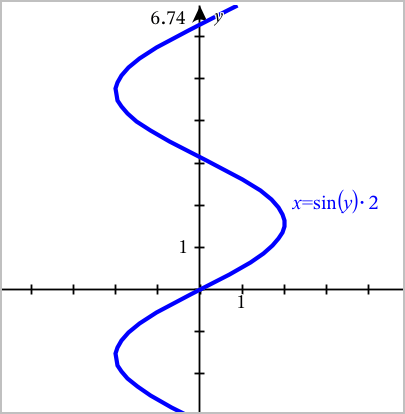
Graphing a Trigonometry Relation from Text
|
1.
|
From the menu, select . |
|
2.
|
Click the work area to place the text box. |
|
3.
|
Type the equation for the trigonometry relation, such as x=sin(y)*2. |

|
4.
|
Press to complete the text object. |
|
5.
|
Drag the text object to either axis to graph the equation. |
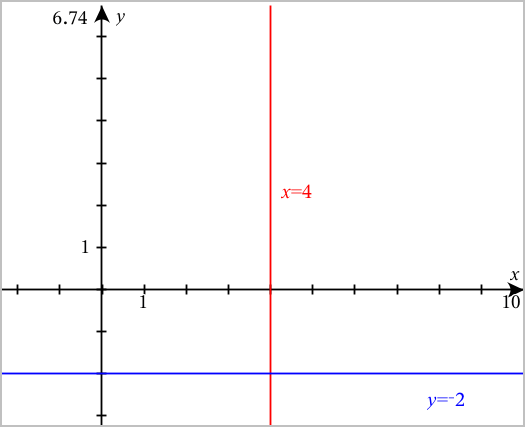
Graphing a Vertical or Horizontal Line from Text
|
1.
|
From the menu, select . |
|
2.
|
Click the work area to place the text box. |
|
3.
|
Type the equation for a vertical line, such as x=4, or a horizontal line, such as y=‑2. Click to complete it. |
|
4.
|
Drag the text object to either axis to graph the equation. |
After plotting a line, you can drag to translate or rotate it.
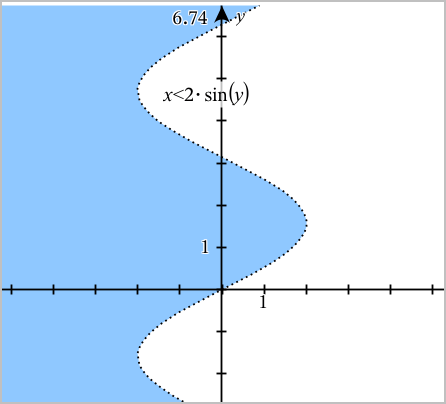
Graphing an Inequality from Text
You can graph inequalities that use the >, <, ≤, or ≥ operators. Areas that satisfy the inequality are shown with shading. If the shaded areas of two or more inequalities overlap, the area of overlap is shaded darker.
|
1.
|
From the menu, select . |
|
2.
|
Click the work area to place the text box. |
|
3.
|
Type the inequality expression, such as x<2*sin(y). Click to complete it. |
|
4.
|
Drag the text object to either axis to graph the inequality. |