The Hide/Show tool reveals objects you have previously selected as hidden and lets you select which objects to show or hide.
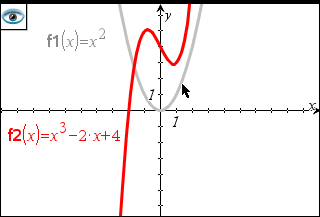
Note: If you hide a graph, its expression is automatically marked as hidden in the graph history.
| 1. | From the Actions menu, select Hide/Show. |
The Hide/Show tool appears at the top of the work area, and currently hidden items (if any) are shown dimmed.
| 2. | Click objects to toggle their hide/show status. You can hide graphs, geometric objects, text, labels, measurements, and individual axis end-values. |
| 3. | Press Esc to complete your selections and close the tool. |
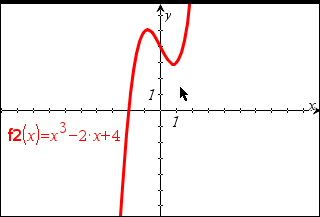
All objects you selected as hidden objects disappear.
| 4. | To view the hidden objects temporarily or restore them as shown objects, open the Hide/Show tool. |