Relation graphing is available on Graphs pages and in the Analytic Window of Geometry pages.
You can define relations using ≤, <, =, >, or ≥. The inequality operator (≠) is not supported in relation graphing.
|
Relation type |
Examples |
|---|---|
|
Equations and inequalities equivalent to |
y = sqrt(x) y-sqrt(x) = 1/2 -2*y-sqrt(x) = 1/2 y-sqrt(x) ≥ 1/2 -2*y-sqrt(x) ≥ 1/2 |
|
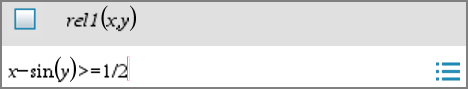
Equations and inequalities equivalent to |
x = sin(y) x-sin(y) = 1/2 x-sin(y) ≥ 1/2 |
|
Conic equations and inequalities |
x^2+y^2 = 5 x^2-y^2 ≥ 1/2+y |
Note: Restrictions imposed by an active Press‑to‑Test session may limit the types of relations you can graph.
| 1. | From the Graph Entry/Edit menu, select Relation. |
| 2. | Type an expression for the relation. |
| 3. | Press Enter to graph the relation. |

| ▶ | You can quickly define a relation from the Function entry line. Position the cursor to the immediate right of the = sign, and then press the Backspace key. A small menu appears with the relation operators and a Relation option. Choosing from the menu places the cursor in the Relation entry line. |
| ▶ | You can type a relation as text on a Graphs page and then drag the text object over either axis. The relation is graphed and added to the relation history. |