The Graphing view lets you graph and explore linear and conic equations analytically in a two-dimensional coordinate system. You can create and analyze lines, circles, ellipses, parabolas, hyperbolas, and general conic equations.
The entry line makes it easy to enter the equation by displaying a template for the type of equation you choose.
| 1. | From the Graph Entry/Edit menu, select Equation > Ellipse, and tap the |
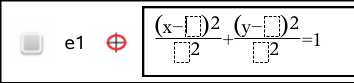
| 2. | Type initial values for the coefficients in the provided spaces. Use the arrow keys to move among the coefficients. |
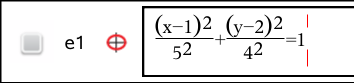
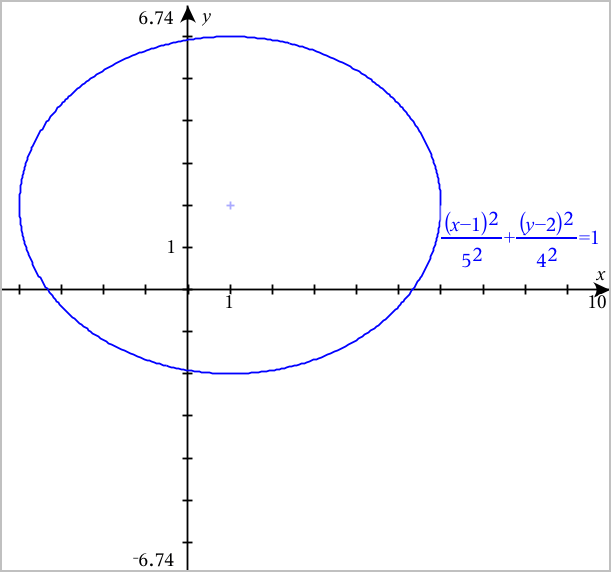
| 3. | Press Enter to graph the equation. |
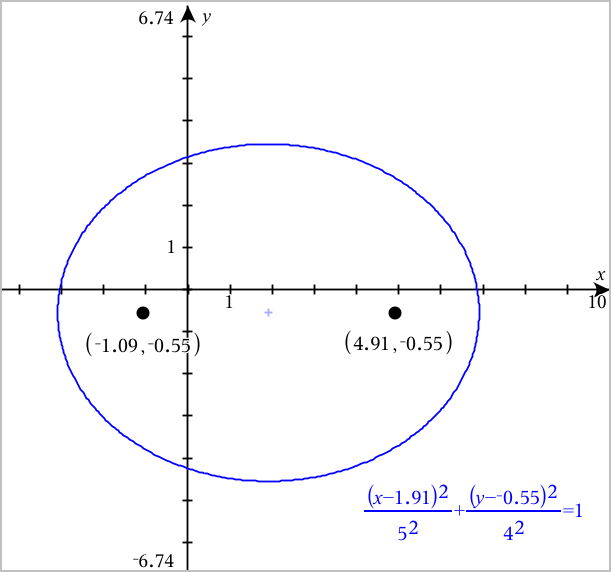
| 1. | Drag the ellipse from its center to explore the effect of translation on the equation. |

| 2. | Use the analysis tools, such as Analyze Graph > Analyze Conics > Foci to further explore the graph. |
Note: The type of conic determines which analysis tools you can use. In the case of the ellipse, you can obtain its center, vertices, foci, axes of symmetry, directrices, eccentricity, and latera recta.
| 3. | To explore translation and dilation interactively, define a conic ellipse that uses variables for the h, k, a, and b coefficients. Insert sliders to vary the parameters. |
