
The Graphs application helps you find zeros, minimums, maximums, intersections, derivatives (dy/dx), or integrals. For Graphs defined as conic sections, you can also find foci, directrix, and other points.
(CAS): You can also find the point of inflection.
| ▶ | To quickly identify maximums, minimums, and zeros, create a point on the graph and then drag the point. |
Temporary signposts appear as you drag through points of interest.
This example illustrates using the Minimum tool. Other analysis tools operate similarly.
| 1. | From the Analyze Graph menu, select Minimum. |
The Minimum icon is displayed at the top left on the work area, and a graph? prompt appears in the work area.
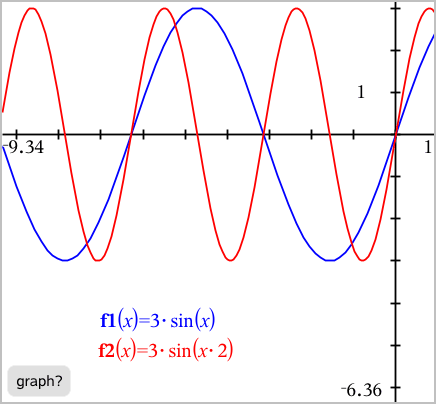
| 2. | Click the graph on which you want to find the minimum. |
A dotted line appears, representing the lower bound of the range to search.

| 3. | Drag the line or click a location to set the lower bound and display a proposed upper bound. |

| 4. | Drag the line representing the upper bound, or click a location to set it. |
The minimum is displayed, along with a text object showing its coordinates.
