A histogram plots one-variable data and depicts the distribution of data. The number of bins displayed depends on the number of data points and the distribution of these points. A value that occurs on the edge of a bin is counted in the bin to the right.
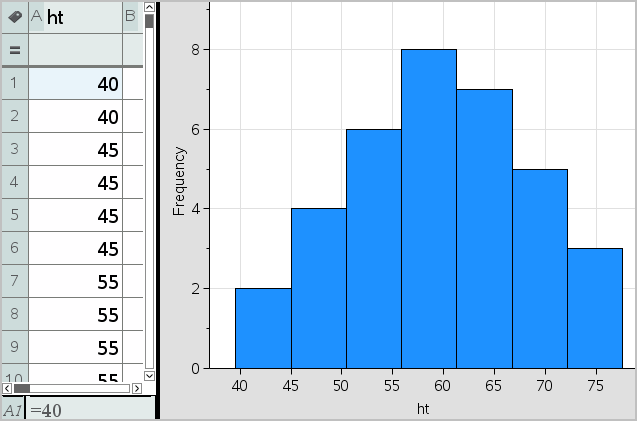
Creating a Histogram from Raw Data
|
1.
|
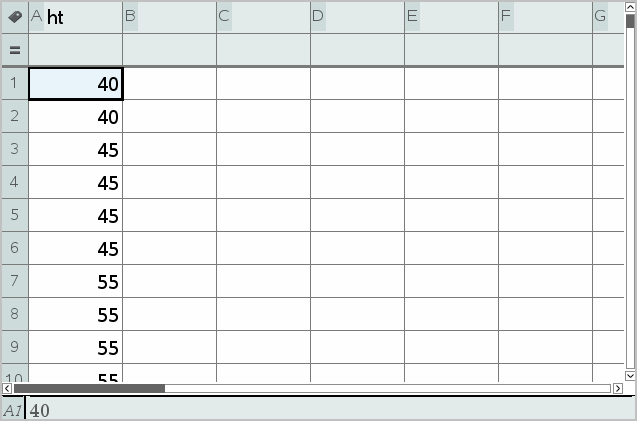
Create the list that you want to plot as a histogram. For example, you can enter or collect data as a named list on a Lists & Spreadsheet page.
|
|
2.
|
On a Data & Statistics page, click the x or y axis, and select your list as the data to plot. |
|
3.
|
From the menu, click . |
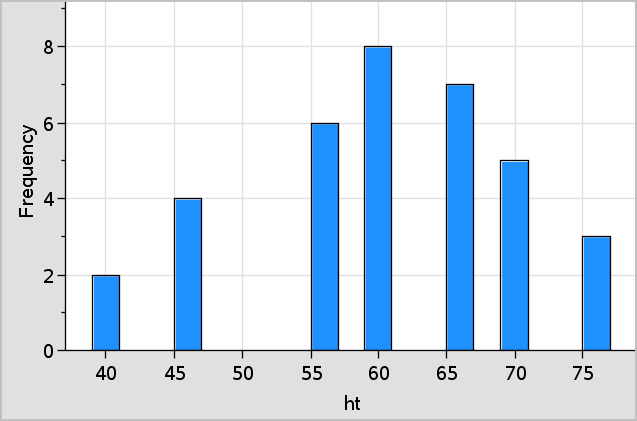
The data forms the bins of a histogram, with Frequency plotted by default on the unselected axis.
|
-
|
Hover over a bin to see the information for that bin. |
|
-
|
Click a bin to select it. Click the bin again to deselect it. |
|
-
|
Drag the side of a bin to adjust bin width and number of bins. |
Note: The bins are not adjustable in categorical plots or plots in which you choose variable bin widths.
|
-
|
On the menu, click and press ◄ or ► to cycle through the bins and display their values. |
Adjusting the Histogram Scale of Raw Data
|
1.
|
On the menu, click and choose .
|
|
2.
|
Choose the format for the scale of the histogram.
|
|
-
|
- displays data based upon the number of values that occur within each bin. This is the default data representation.
|
|
-
|
- displays data in the histogram by each group’s percent value of the whole data set.
|
|
-
|
- displays data based upon the density of each group within the data set.
|
Creating a Histogram with Frequency or Summary Data
|
1.
|
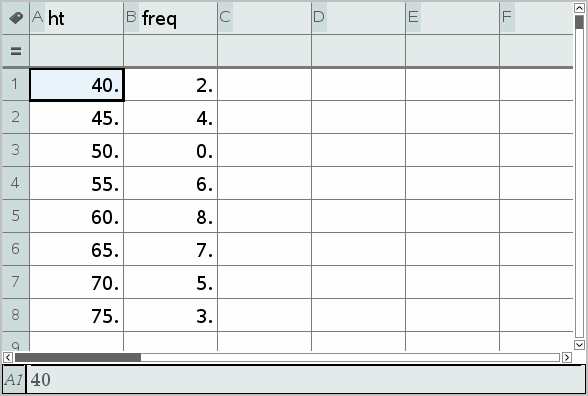
On a Lists & Spreadsheet page, create two lists: one containing the “bins,” such as heights in a population (ht), and the other containing the frequencies of those heights (freq). |
|
2.
|
On a Data & Statistics page, access the context menu on the x axis, and click . |
|
3.
|
Select ht as the X List and freq as the Summary List. |
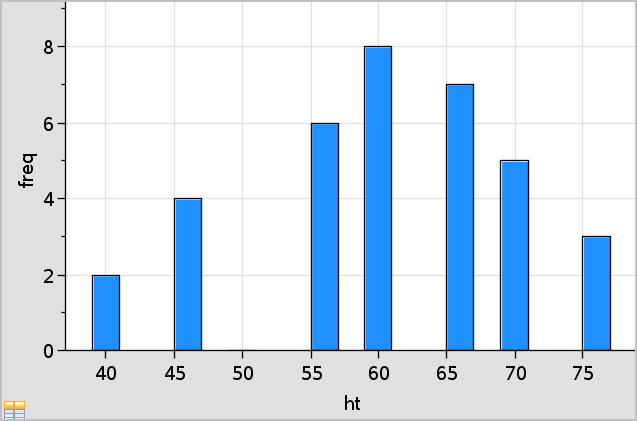
Note: It is up to you to set the data and bins in a meaningful way when using summary data.
Setting Equal Bin Widths
By default, bin widths are set to equal. You can specify the width and alignment of equal-width bins.
|
1.
|
On the menu, click , and choose .
|
The dialog box opens.
|
2.
|
Type values to set and of the bins.
|
|
3.
|
Click to apply the changes and redraw the bins.
|
Both the data represented by the bins and the value you type for the alignment affect the placement of bins on the scale.
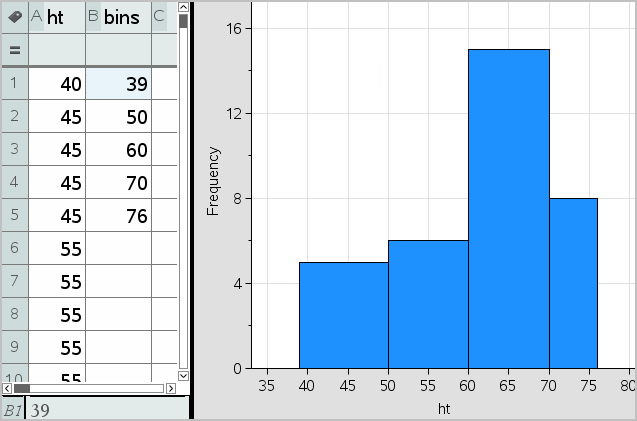
Setting Variable Bin Widths
You can set variable bin widths based on a list of bin boundaries.
|
1.
|
Create a named list containing boundary values.
|
For example, a boundary list defined as {60,70,100,110} will create bins at 60 to 70, 70 to 100, and 100 to 110.
Note: The data must fall within the specified bin widths. For example, a data point of 115 would be outside the bins in the above list, and you would receive a Data/Bin Location Mismatch error.
|
2.
|
On the menu, click , and choose .
|
The dialog box opens.
|
3.
|
Select your boundary list as the .
|
|
4.
|
Click to apply the changes and redraw the bins.
|
Note: You cannot change variable bin widths by dragging their boundaries; you must edit the list of boundaries or restore equal-width bins.
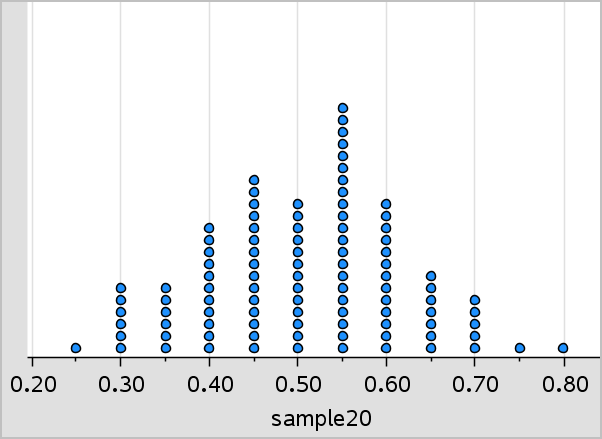
 Creating Dot Plots