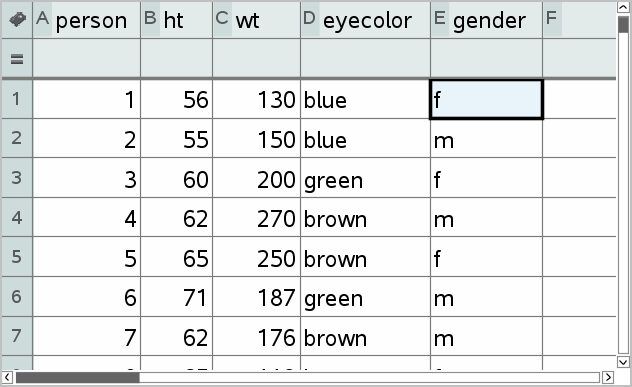
You are here: Data & Statistics > Overview of Raw and Summary Data

Overview of Raw and Summary Data

You can create plots directly from raw data or from a summary table.


Raw data


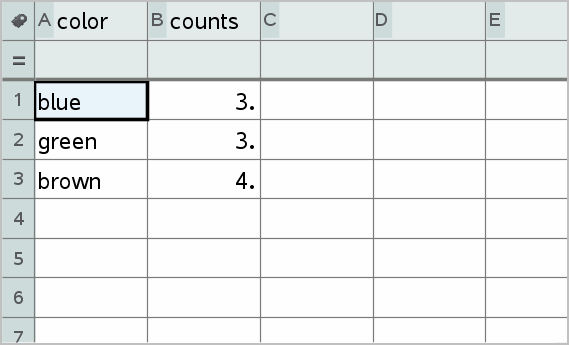
Summary table for eye color based on raw data

Raw data consists of a single list, such as a list of eye colors. When you create a plot of raw data, Data & Statistics counts the occurrences for you. Plotting raw data directly gives you flexibility in analyzing it.
A summary table consists of two lists, such as eye colors (the X or Y List) and counts of eye-color occurrences (the Summary List). For more information, see Using Lists & Spreadsheet chapter.


© 2006 - 2016 Texas Instruments Incorporated