To plot variables, start with a problem that includes a Data & Statistics application and lists created in the Lists & Spreadsheet application or the Calculator application.
|
1.
|
Click the Add Variable region near the center of an axis. |
If no variable is plotted on the axis, the tooltip displays.
A list displays the names of available variables.

|
3.
|
Click the name of the variable to plot. |
Note: By convention, the independent variable is shown on the x‑axis.
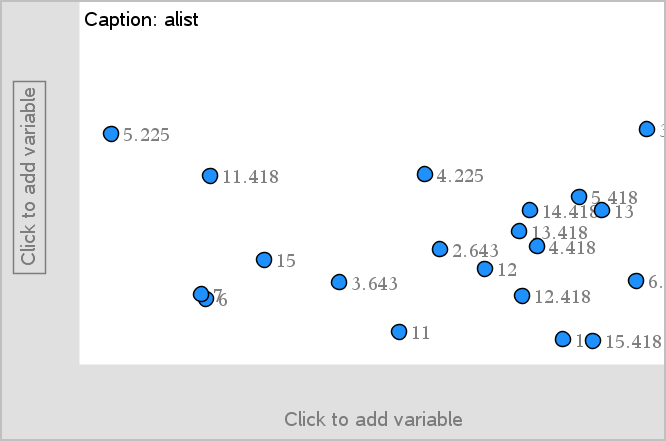
The default plot for one variable is a dot chart. The data points in the default caseplot reposition to represent the elements of the selected variable in a dot chart.
|
4.
|
(Optional) Click the Add Variable region near the center of the remaining axis to plot a second variable. |
The default plot for two variables is a scatter plot. The data points shift to represent the elements of both variables as a scatter plot.
|
5.
|
(Optional) Repeat Steps 1-3 to choose additional variables to plot on the vertical axis. |
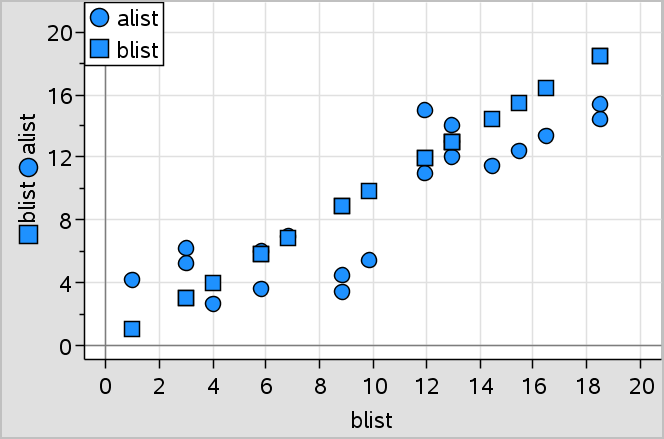
The name of each variable that you add is appended to the label on the axis. The default data point shape changes to help you distinguish data, and a legend is displayed to identify the shapes.
|
6.
|
Change, analyze, or explore the plotted data. |
|
-
|
Remove or change the variable on an axis by clicking the Add Variable region again. |
|
-
|
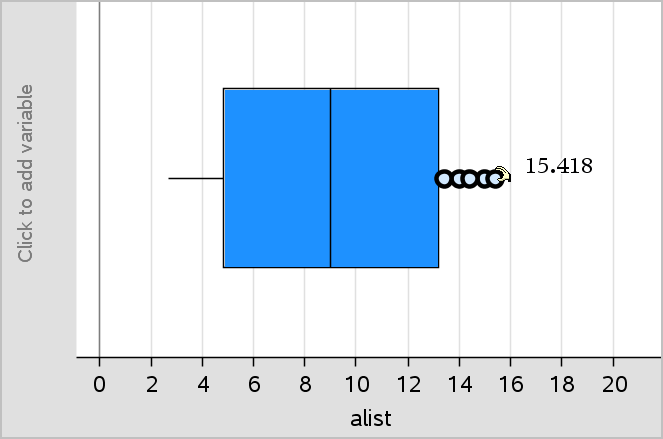
View the plotted data in another supported plot type by selecting a tool from the menu. |
|
-
|
Choose the Graph Trace tool on the menu and press ◄ or ► to move across the data points in the plot. |
|
-
|
The lists that you plot as variables can include incomplete or missing cases. (A case is the data contained in a row of cells in the Lists & Spreadsheet application.) The Lists & Spreadsheet application displays a void as an underscore (“_”), and Data & Statistics plots no data point for a void cell. |
 Changing Data & Statistics Settings