You can graph functions by typing them in Data & Statistics, or you can graph functions defined in other applications.
You can use the Plot Function tool to plot functions in a work area that already includes a plot on the axes. Plot Function lets you specify and graph a function for comparison to an existing plot.
To use the Plot Function tool:
1. | Create or open a problem that includes variables (from Lists & Spreadsheet) that are plotted on a Data & Statistics work area. Ensure that your work area contains both a horizontal axis and a vertical axis scale. |
2. | From the Analyze menu, click Plot Function. |
A function entry field displays in the work area.
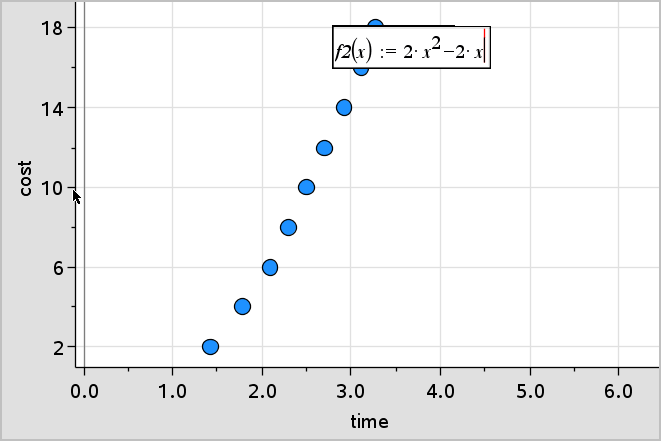
Note: You can edit the function’s expression typed in the entry field. However, the function graphed in Data & Statistics cannot be manipulated or moved around the work area. To do that, use Graphs & Geometry.
3. | Type the function in the entry field, and press Enter. |
Note: You can rename the function by typing over f1(x): with another name, if you choose.
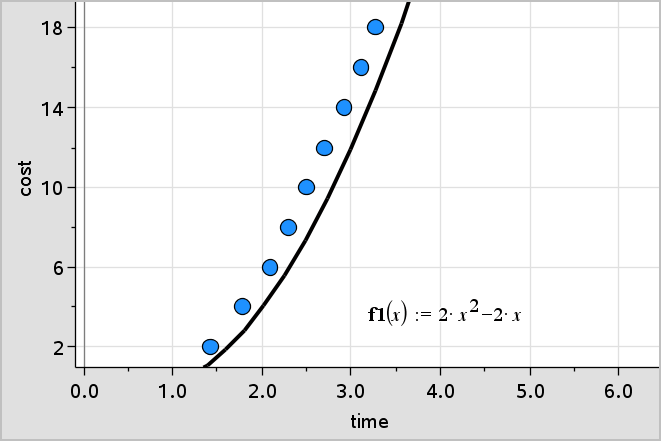
The function graphs in the work area and is saved as a variable for use in other applications.
You can enter a function that has been defined as a variable in another application, such as Lists & Spreadsheet, Graphs & Geometry, or Calculator.
1. | Add a variable to each axis. You can access any variables defined in a Lists & Spreadsheet or Calculator application in your problem from the variable list. |
2. | From the Analyze menu, click Plot Function. |
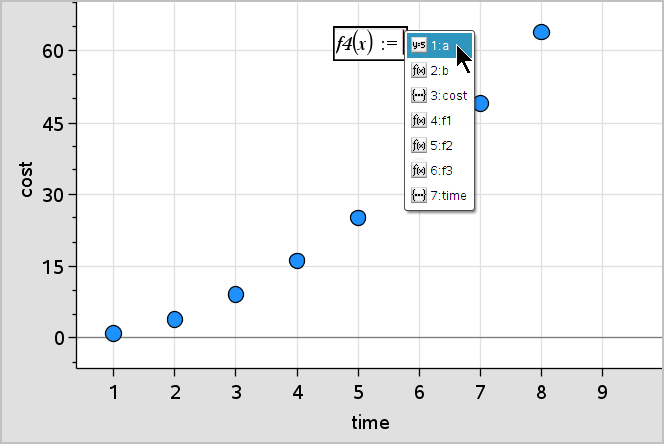
A function entry field displays in the work area.
3. | Click on the toolbar. |
Handheld: Press h.
A list of variables available in the problem displays.
4. | Click to select the variable containing the function you want to plot. |
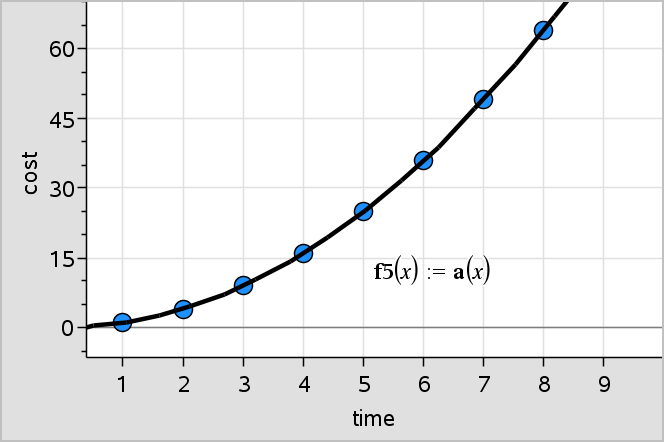
In the example below, the variable a contains the function f(x)=x2.
5. | Press Enter. |
The function plots in the work area.
You can edit a function and update it in the work area.
1. | You can edit a function by double-clicking the equation and then making changes as required. |
2. | Press Enter after making all changes and the updates are displayed in the work area. |
Data & Statistics functions are stored as variables, and may be used in other applications, in the same manner as any other variable. Support for all function types is included.
Note: Function numbers increment to use the next available. If you have defined f1(x) and f2(x) in Graphs & Geometry, the first function you create in Data & Statistics will be f3(x).
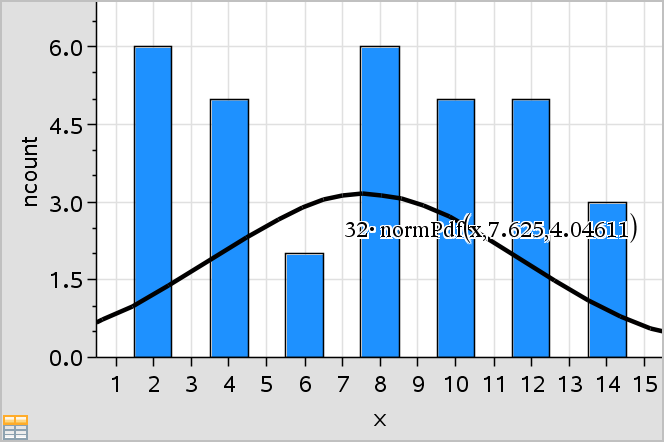
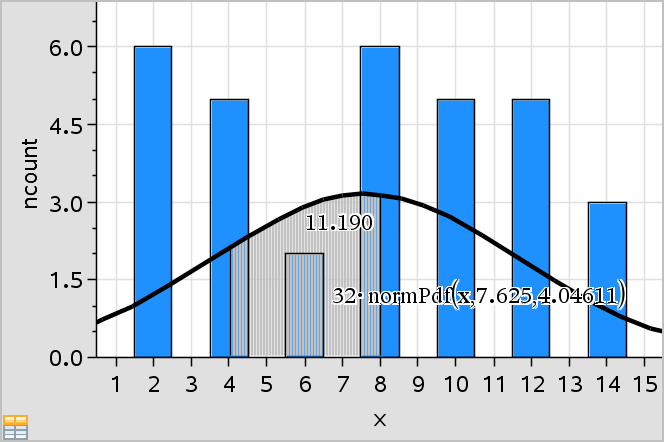
You can approximate data plotted in the Data & Statistics work area against the normal probability density function. The tool overlays the normal probability density function using the mean and the standard deviation of the data in the histogram.
To show the normal probability density function for plotted data:
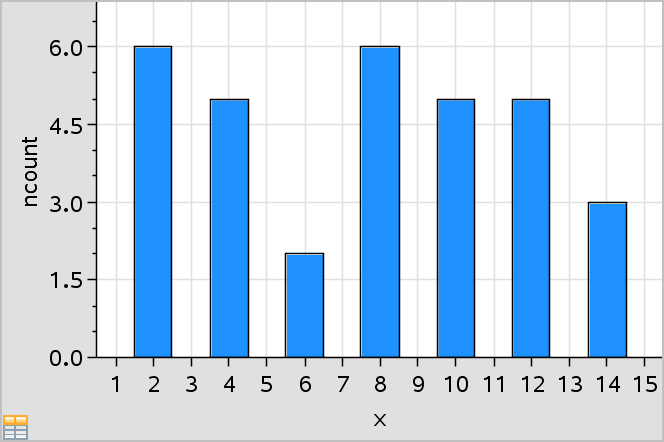
1. | Add a variable to the x-axis. |
2. | On the Plot Types menu, click Histogram. |
Note:Show Normal PDF is available only when histogram is the plot type.
3. | From the Analyze menu, click Show Normal PDF. |
The normal PDF for the graph plots in the work area. The expression used to calculate the PDF displays when selected.
You can click Hide Normal PDF on the Analyze menu to remove the PDF.
Use Shade Under Function to find the area of a selected region under a function graphed in the work area.
1. | Select any function graphed in the Data & Statistics work area. For example, select a previously graphed normal PDF. |
2. | From the Analyze menu, click Shade Under Function. |
The pointer becomes a dotted vertical line and the boundary +/- ˆ displays when you position the mouse near the boundary on the left or right. You can click when ˆ displays to set it as a boundary.
3. | Select a point on the curve and click to indicate where to start shading under the function. The direction in which you move next determines whether the region shaded is on the left, right, or center of the curve. |
4. | Select a point on the curve and click to indicate the end boundary of the shaded area. A region under the function is shaded based on the points you selected. |
You can work with Shade Under Function in the following ways:
• | Select the region to display the values for data points in the shaded area. |
• | To remove the shading, right-click or Ctrl-click the shaded region and choose Remove Shaded Region. |
• | To change the fill color of the shaded area, right-click or Ctrl-click the shaded region, choose Color, choose Fill, and click a color. |
• | Use plot value to set the boundary to an exact number. When a boundary for shading is set to a plotted value, you can change the plotted value to update the shading. |
• | Edit a shaded region by clicking and dragging the edge at the starting or ending boundary. |