

Statistical Calculations and Results
You can perform statistical calculations to analyze data.
Note: The following example fits a y=mx+b linear regression model to two lists.
| 1. | Tap the column formula cell (second cell from the top) in column A. |
| 2. | Tap Tools  and go to Statistics > Stat Calculations > Linear Regression (mx+b) to choose the regression model. and go to Statistics > Stat Calculations > Linear Regression (mx+b) to choose the regression model.
|
| 3. | Tap  next to the Y List box to display a named list.
Tap the name of the list for the Y List. next to the Y List box to display a named list.
Tap the name of the list for the Y List. |
| 4. | To store the regression equation in a specified variable, replace Save RegEqn To with the name of the variable. |
| 5. | Tap the 1st Result Column box and type c[] as the column letter for the first result column. |
| 6. | Tap OK. |
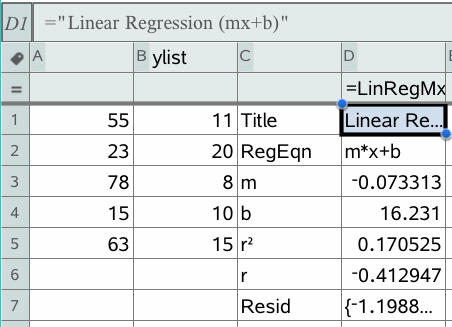
Note: The results are linked to the source data.
The Lists & Spreadsheet application stores statistical results using a variable-group name with the format stat.nnn, where nnn is the result name (for example, stat.RegEqn and stat.Resid). If you want to use a custom variable group instead of the standard name, edit the formula in the column formula cell. You could use the following formula to store the results in the variable group MystatsB.
=LinRegMx(a[],b[],1 ): CopyVar Stat., MystatsB.
Later, you could view the results by entering the following expression in the Calculator application or in another column of the Lists & Spreadsheet application:
MystatsB.results