Graphing Spreadsheet Data
| 1. | Name both of the columns to declare them as lists, and then select both columns. |
| 2. | Tap Tools  and go to Data > Quick Graph. and go to Data > Quick Graph. |
A Data & Statistics application is added to the page with the plotted data.
Note: In this example, you create a summary table from raw data, and then use the table to generate a summary plot.
| 1. | Create a list that holds the category identifiers. For this example, name the list “color” and type strings for eye color. |
| 2. | Create the summary list. For this example, name the list “counts” and type the total count for each of the eye colors. |
| 3. | Select either list. |
| 4. | Tap Tools and go to Data > Summary Plot.
|
| 5. | If necessary, change the lists for X List and Summary List. |
| 6. | In the Display On field, select how to display the summary plot in the Data & Statistics application, and then tap OK. |
| 1. | Clear the columns you plan to use for the captured data. |
| 2. | Ensure that the data values you want to capture are linked to variable names. |
| 3. | Tap the column formula cell (the second cell from the top) of the column in which you want to capture the values. |
| 4. | Tap Tools and go to Data > Data Capture > Automatic.
|
A capture expression is inserted.
| 5. | Replace the letters “var” with the name of the variable to capture. |
Note: You can also select the variable name from the Variables menu by tapping var, and then tapping the desired variable.
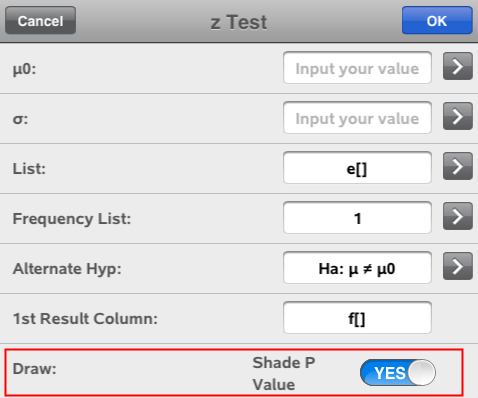
Tools on the Statistics menu provide access to wizards that help you perform statistical analyses on the data in table columns. You specify the location of the data, and the Lists & Spreadsheet application stores the results in two columns: one for the result names, and one for the corresponding values.