

Adjusting Variable Values with a Slider
In the Graphs, Geometry, and Data & Statistics applications, a slider control lets you adjust or animate the value of a numeric variable.
|
|
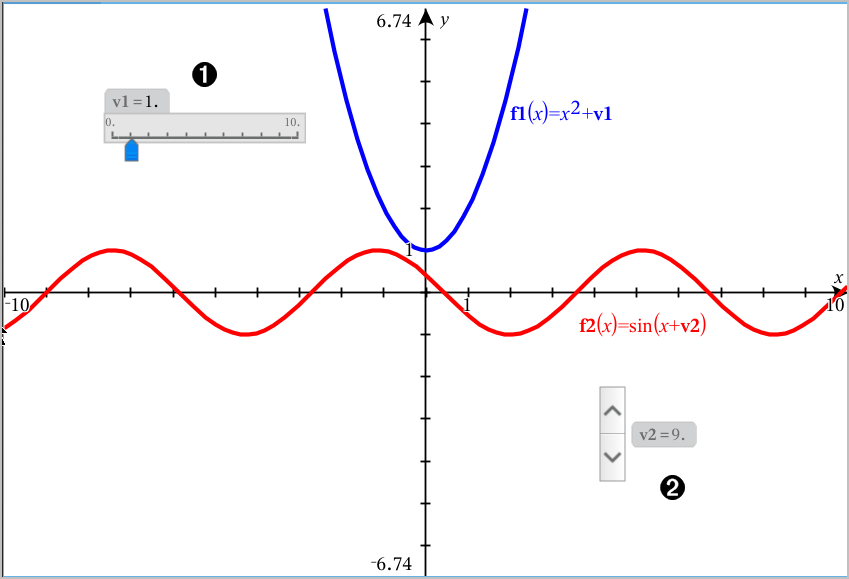
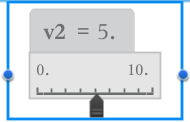
Horizontal slider for adjusting variable v1. |
|
|
Minimized vertical slider for adjusting variable v2. |


Inserting a Slider
| 1. | Start in a Graphs, Geometry, or Data & Statistics page. |
| 2. | Tap Tools  and go to Actions > Insert Slider. and go to Actions > Insert Slider. |
The Slider Settings screen opens.
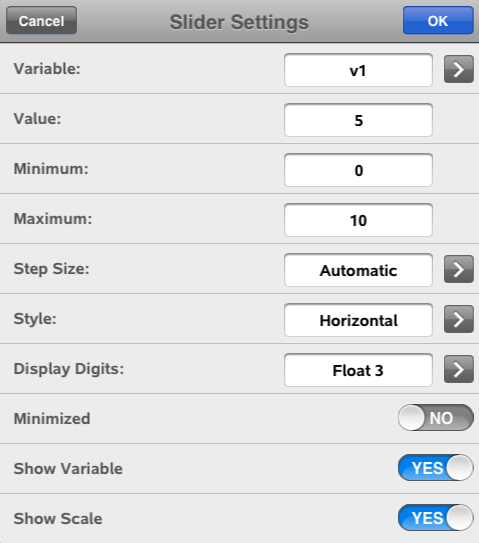
| 3. | Enter desired values. |
| 4. | Tap OK. |
The slider is displayed in the work area. Handles on the slider let you move or stretch it. To remove the handles, tap the work area.
| 5. | To adjust the variable, slide the pointer (or tap the arrows on a minimized slider). |
Working with the Slider
Use the options on the context menu to move or delete the slider, and to start or stop its animation. You can also change the slider's settings. To open the context menu:
| 1. | Touch and hold the slider. |
The context menu opens.
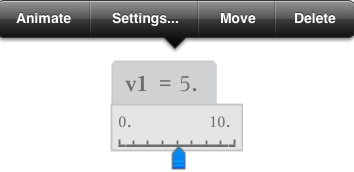
| 2. | Tap an option to select it. |