

You are here: Welcome to the TI‑Nspire™ App for iPad® > Data & Statistics Application > Working with Plots
Working with Plots
Dot Plots

|
|
Box Plots

|
|
Histograms
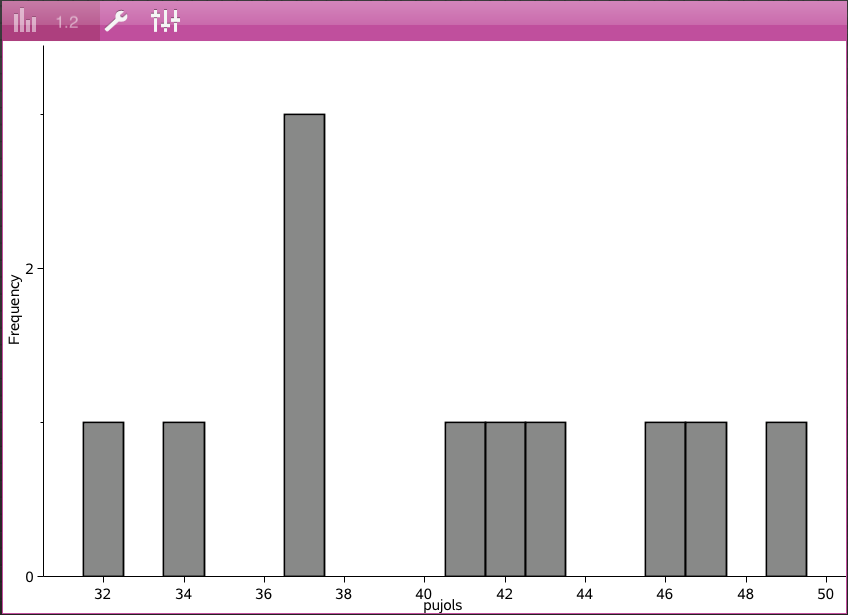
|
|
Normal Probability Plots
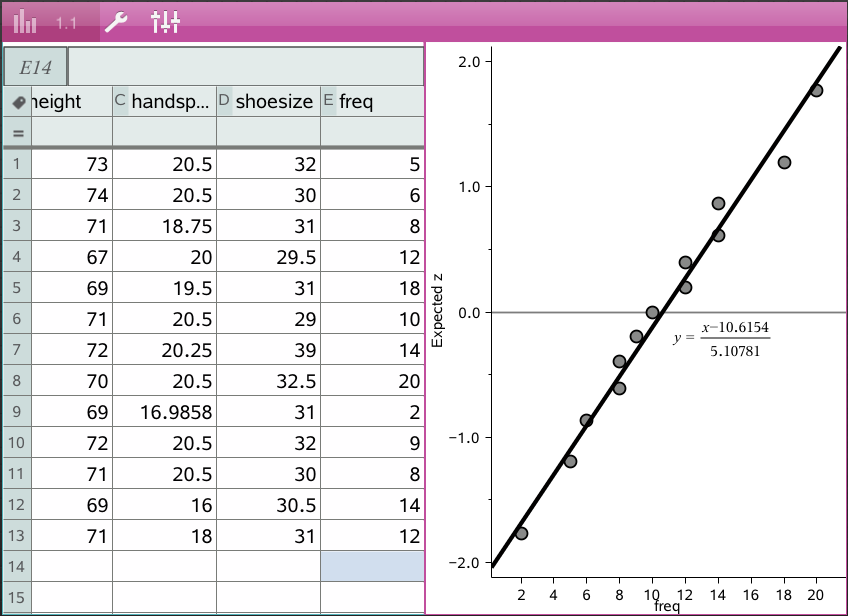
|
Shows one set of numerical data against the corresponding quartile (z) of the standard normal distribution. |
Scatter Plots

|
|
X-Y Line Plots
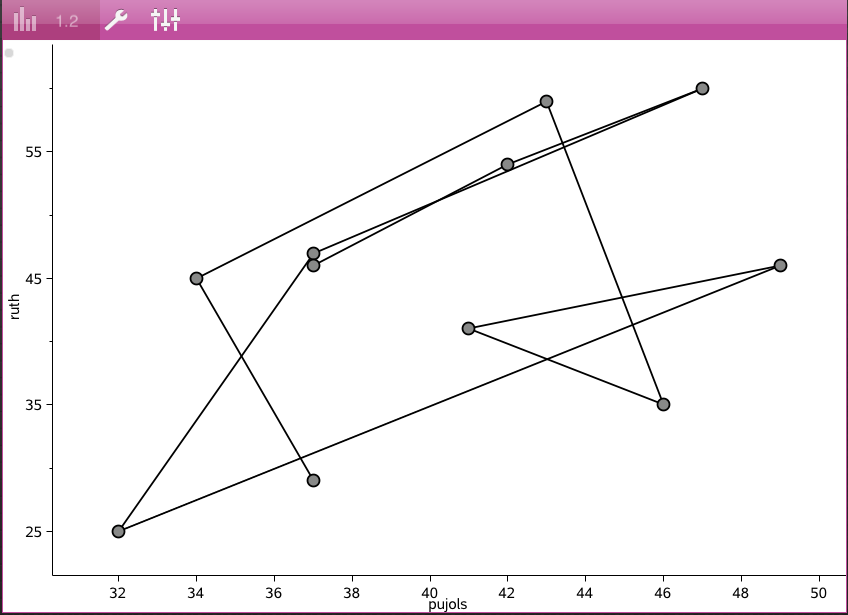
|
|
Exploring and Analyzing Plotted Data
| • | Drag a point to move it. As you move a point, the values associated with the point change in the work area and in the list of variables. |
| • | To change a variable on an axis, tap the Add Variable region, and then tap another variable name. |
| • | From the Tools  menu: menu: |
| - | Tap Plot Type to select another supported plot type. |
| - | Tap Plot Properties to clear all variables or to modify properties such as add and remove X and Y variables, add a summary list, or force a categorical X. |
| - | Tap Actions to insert text or sliders. You can also select all points in the plot. |
| - | Tap Analyze to choose analysis options such as add a moveable line, plot a value or function, or activate the Graph Trace tool. |