

You are here: Welcome to the TI‑Nspire™ App for iPad® > Data & Statistics Application > Working with Charts
Working with Charts
Dot Charts

|
|
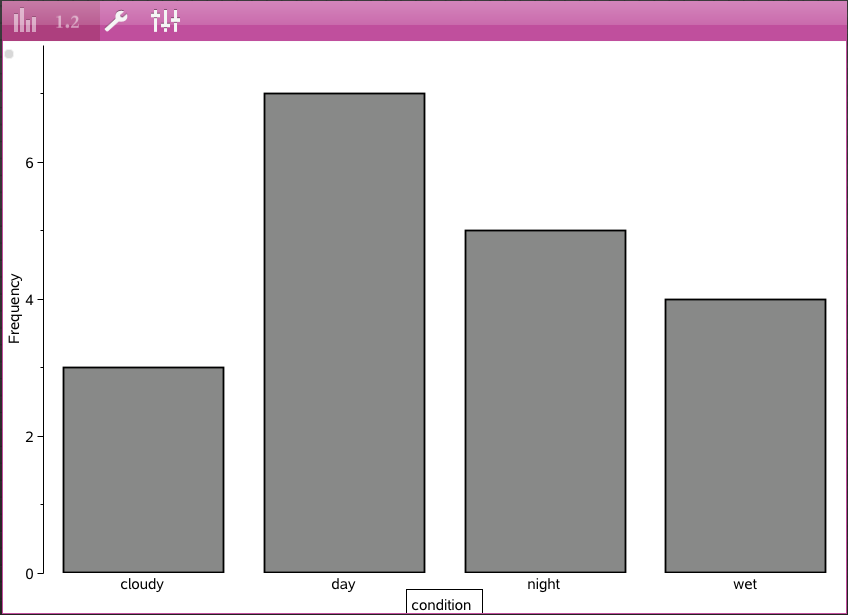
Bar Charts
|
|
|
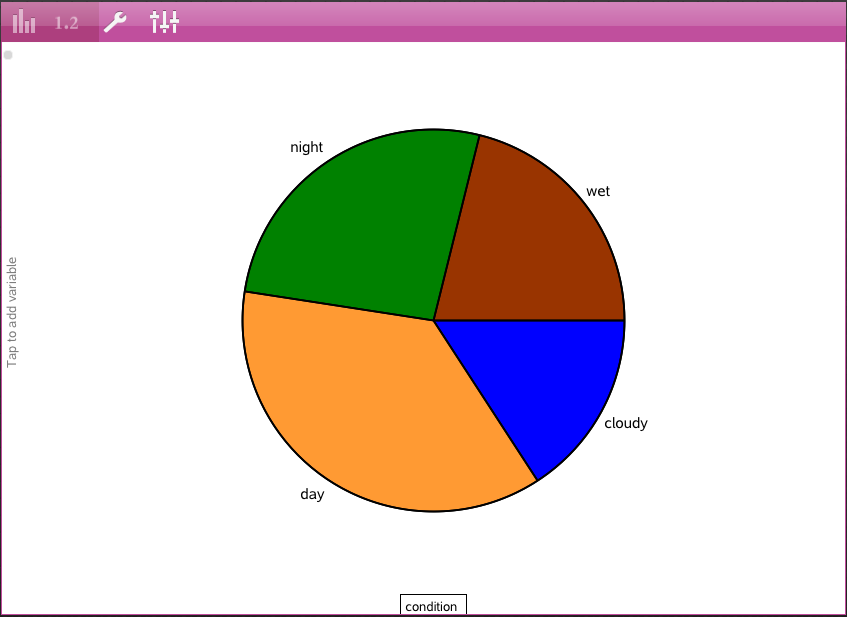
Pie Charts
|
|
A pie chart represents categorical data in a circular layout and uses a proportioned segment for each category. |
Exploring and Analyzing Data Plotted in a Chart
| • | Drag a point to move it. as you move a point, the values associated with it change in the work area and in the list of variables. |
| • | From the Tools  menu: menu: |
| - | Tap Plot Type to choose another supported plot type. |
| - | Tap Plot Properties to clear all variables, or to modify applicable properties such as add and remove X and Y variables, add a summary list, and force a categorical X. |
| - | Tap Actions to insert text and sliders. You can also select all points in the plot. |
| - | Tap Analyze to choose applicable analysis options such as adding a moveable line, plotting a value or function, or activating the Graph Trace tool. |