About Vernier DataQuest™
|
•
|
Run the application on either a TI‑Nspire™ handheld or a Windows® or Mac® computer. |
|
•
|
Choose from multiple sensor interfaces and sensors, such as the TI‑Nspire™ Lab Cradle, to collect data. |
|
•
|
Collect data with up to five connected sensors (three analog and two digital) using the TI‑Nspire™ Lab Cradle. For a complete list of compatible sensors, see Compatible Sensors. |
Important: The TI-Nspire™ CM‑C Handheld is not compatible with the Lab Cradle and only supports the use of a single sensor at a time.
|
•
|
Collect data either in the classroom or at remote locations using collection modes such as time-based or event-based. |
|
•
|
Select and focus on a subset of collected data. |
|
•
|
Collect several data runs for comparison. |
|
•
|
Create a graphical hypothesis using the Draw Prediction feature. |
|
•
|
Play back the data set to compare the outcome to the hypothesis. |
|
•
|
Analyze data using functions such as interpolation, tangential rate, or modeling. |
|
•
|
Display results in a graph or a table. |
|
•
|
Customize the way results are displayed. |
|
•
|
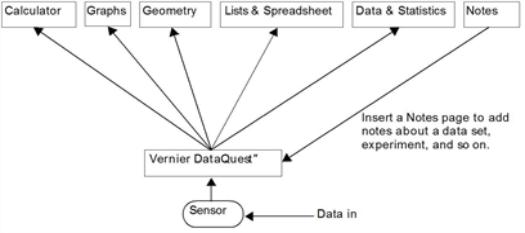
Link the data to other TI‑Nspire™ applications. |
Using Vernier DataQuest™ Data in Other TI-Nspire™ Applications
Data obtained during a data collection run is written to the graph and table views in the Vernier DataQuest™ application and can be used in these TI‑Nspire™ applications:
This graphic shows how data can be shared among the applications.