Use the Show Graph menu to show separate graphs when using:
| • | A sensor that plots more than one column of data. |
| • | Multiple sensors with different defined units at the same time. |
You can display the top graph (Graph1), bottom graph (Graph 2), or both.
In this example, two sensors (the Gas Pressure sensor and the Hand Dynamometer) were used in the same run. The following image shows the columns Time, Force, and Pressure in the Table view to illustrate why two graphs are shown.
| ¢ | Select View > Graph. |
When two graphs are displayed, the top graph is Graph 1 and the bottom graph is Graph 2.
To display only Graph 1:
| ¢ | Select Graph > Show Graph > Graph 1. |
Only Graph1 is displayed.
| ¢ | Select Graph > Show Graph > Graph 2. |
Only Graph 2 is displayed.
To display both Graph 1 and Graph 2 together:
| ¢ | Select Graph > Show Graph > Both. |
Graph1 and Graph 2 are displayed.

Use the Page layout view when Show Graph is not the appropriate solution for showing more than one graph.
The Show Graph option is not applicable for:
| • | Multiple runs using a single sensor. |
| • | Two or more of the same sensors. |
| • | Multiple sensors that use the same column(s) of data. |
To use Page Layout:
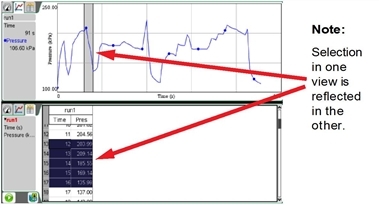
| 1. | Open the original data set you want to see in two graph windows. |
![]()
| 2. | Click Edit > Page Layout > Select Layout. |
Handheld: Press ~, and then select Page Layout > Select Layout.
| 3. | Select the type of page layout you want to use. |
In this example, the top and bottom ![]() page symbol was selected.
page symbol was selected.
![]()
| 4. | Click Click here to add an application. |
Handheld: Press b.
| 5. | Select Add Vernier DataQuest. |
The Vernier DataQuest™ application is added to the second view.
| 6. | To see separate views, click the view you want to change, and then select View > Table. |
The new view is displayed.
| 7. | To show the same view, click the view to change. |
| 8. | Click View > Graph. |
The new view is displayed.