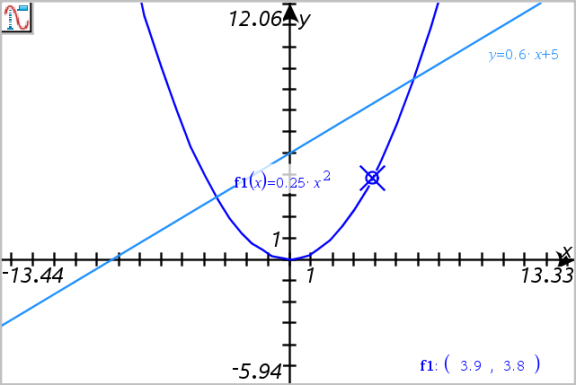
Graph Trace lets you move a trace cursor over the points of a graph or plot and displays value information.
| 1. | From the Trace menu, select Graph Trace. |
The Graph Trace tool appears at the top of the work area, the trace cursor appears, and the cursor coordinates are displayed in the lower right corner.

| 2. | Explore a graph or plot: |
| - | Point to a position on a graph or plot to move the trace cursor to that point. |
| - | Press ◄ or ► to step the cursor along the current graph or plot. The screen pans automatically to keep the cursor in view. |
| - | Press ▲ or ▼ to cycle among the displayed graphs. |
| - | Click the trace cursor to create a persistent point. Optionally, enter a specific independent value to move the trace cursor to that value. |
| 3. | To stop tracing, press Esc. |
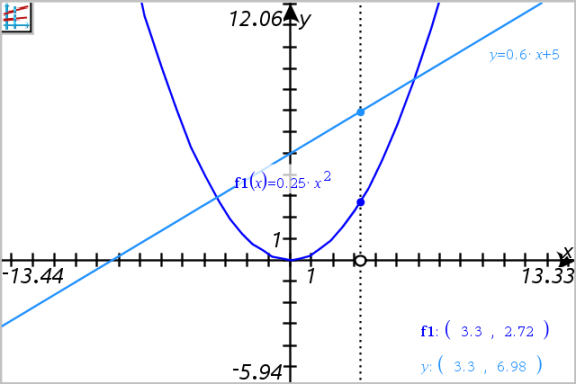
The Trace All tool allows tracing multiple functions simultaneously. With several functions graphed on the work area, perform the following steps:
Note: The Trace All tool traces only function graphs, not plots of other relations (polar, parametric, scatter, sequence).
| 1. | From the Trace menu, select Trace All. |
The Trace All tool appears in the work area, a vertical line indicates the x value of the trace, and the coordinates for each traced point are displayed in the lower right corner.

| 2. | Explore the graphs: |
| - | Click a point on the x axis to move all the trace points to that x value. |
| - | Press ◄ or ► to step the trace points along all the graphs. |
| 3. | To stop tracing, press Esc. |
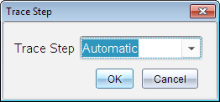
| 1. | From the Trace menu, select Trace Step. |

| 2. | Choose Automatic or enter a specific step size for tracing. |
 Tracing Specific Graphs