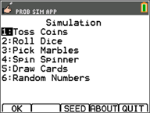
|
Tip: Options display at the bottom of the screen to help you navigate and perform specific tasks.
To select one of these options, press the graphing key directly below it.
For example, to select [TBL], press s.
|
|
|
|
|
|
4.
|
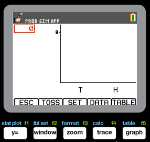
Use the following key presses for this App: |
|
•
|
ESC to move to previous screen |
|
•
|
TOSS to toss one coin and access more tosses |
|
•
|
SET to get to the Settings screen (see below) |
|
•
|
DATA to store the collected data to a list |
|
•
|
TABL to show a table of the trials |
|
•
|
GRPH to show a graph of the trials |
Note: You can toggle between the table and the graph.
|
|
|
5.
|
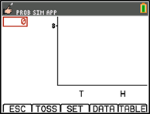
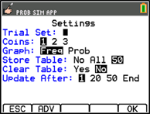
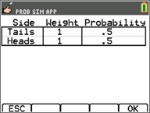
Change these settings depending on what values are needed for the simulation. Press ADV from the Settings screen to change the weight of the coins. |
|
|
|
6.
|
Currently, the coins are equally weighted. Press OK when the settings and the weight for the simulation are appropriate. Next, press TOSS . |
|
|
|
7.
|
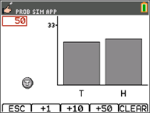
One coin will toss. Now, press +1, +10, or +50 depending on the data you wish to collect. The Frequency Graph updates with each coin toss. Press <ESC> when finished tossing the coins for this simulation. |
|
|
|
8.
|
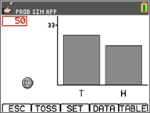
Next, press ESC and examine the table (TABL) or use DATA to store the data into lists. |
|
|
|
9.
|
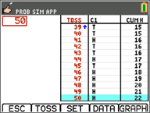
Press TABL to see the value for each toss and the cumulative number of heads for the number of trials. |
|
|
|
10.
|
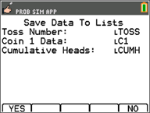
Press DATA to store the data in lists, which can be accessed later in the List Editor. The values of 0 for Tails and 1 for Heads are stored in list LC1. |
|
|
|
11.
|
Next, quit the App by pressing OK, <ESC, YES, QUIT, YES. Make sure to save the data in lists (as shown above) so the simulation remains in memory when you turn the graphing calculator off. |
|
|

