Understanding the Data View
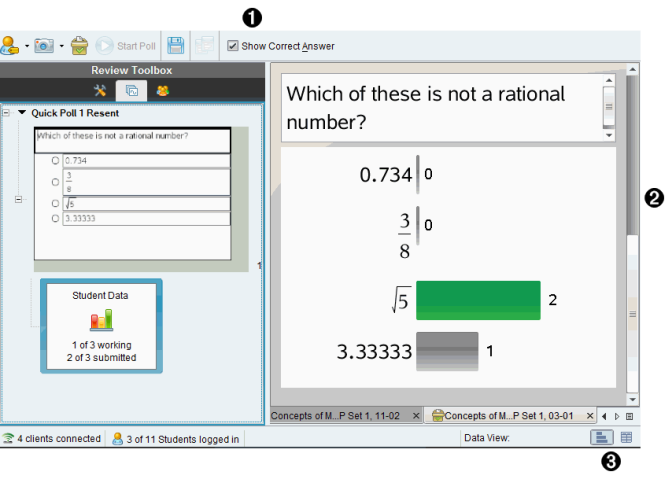
The Data View pane displays the question in the open document, as well as the responses to that question. You can view live results in the Data View pane. The data is updated in real time as students respond to Quick Poll and Open Response questions, graph functions or move points on a graph.
The Data View icons allow you to view responses in the Data View pane as a bar chart, graph or table. Each view shows the student responses and the frequency of each response.
The bar chart and table views are available for all question types and Quick Poll documents. The graph view is available in equation, coordinate points and list questions.
Expression and equation questions have an additional "Show Your Work" data view available, if you marked the question for students to show their work. The "Show Your Work" data view is retained when you close and reopen the Review Workspace.
The following examples show the same data displayed in different data views.
Click  to view the data in bar chart form.
Click  to view the data in graph form.
When you are in graph view, the Graph Tools are available to allow you to work with the graph. The settings in the graph are retained when you close and reopen the Review Workspace.
In the bar chart and graph views, hover your mouse pointer over a response to see a list of students who gave that response.

Click  to view the data in table form.
The table view is available as a frequency table or as a student table.
| ▶ | To view data in different table views, click the Organise tool in the Review toolbox, and then click Frequency Table or Student Table. |
A frequency table shows the responses with the number of times the response occurred. Click the Response heading to sort the responses in ascending order, descending order or question order. Click the Frequency heading to sort by frequency of response.
A student table shows the student names with their responses. Click the Student heading to sort the responses in ascending or descending alphabetical order. Click the Response heading to sort the responses in ascending order, descending order or question order.
The settings for sorting and sizing columns are retained for each document when you close and reopen the Review Workspace.