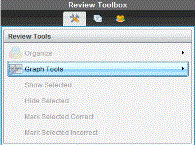
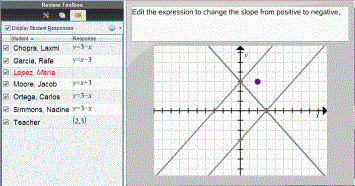
There may be times you want to add your own data to a graph you are reviewing in class. The Graph Tools allow you to add teacher points and teacher equations to a graph and to set the plot list settings and individualise student responses.
Teacher data is displayed larger than student data and in a different colour.
When you add teacher data, the software re-evaluates the data and the Data View pane updates the view to reflect the changes.
You can hide and show teacher data, but you cannot mark a teacher response as correct or incorrect.
Adding Teacher Points
| 1. | Click Graph Tools in the Review toolbox. |

| 2. | Click Add Teacher Point. |
The Add Teacher Point dialogue box opens.

| 3. | Type your information in the fields. |
Click  to open maths templates and symbols that you can add to the fields.
| 4. | Click OK. |
Your point is displayed on the graph and the name Teacher is added to the list of names in the Student pane.
Note: The teacher may have multiple entries.

Adding Teacher Equations
| 1. | Click Graph Tools in the Review toolbox. |

| 2. | Click Add Teacher Equation. |
The Add Teacher Equation dialogue box opens.

| 3. | Type your information in the field. |
Click  to open maths templates and symbols that you can add to the fields.
| 4. | Click OK. |
Your line is displayed on the graph and the name Teacher is added to the list of names in the Student pane.
Note: The teacher may have multiple entries.