Exploring Notes with Examples
This section shows you how the Notes application works with other applications to automatically update results.
Example #1: Using Notes to Explore Roots of a Quadratic Function
|
1.
|
Open a new document and start the Notes application. |
|
2.
|
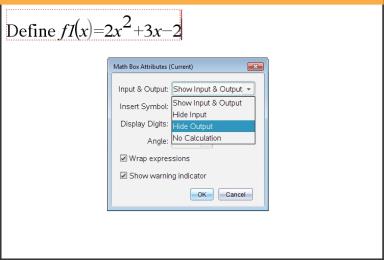
Define a function in a maths box, evaluate, and hide the output using the Maths Box attributes. |
|
3.
|
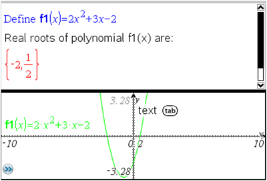
Type some more text; for example: “Real Roots of f1(x) are:” |
|
4.
|
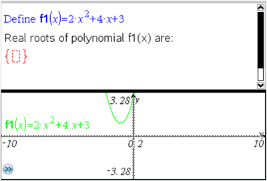
In a new maths box, type: polyRoots(f1(x),x). |
|
5.
|
Press · and hide the input of this maths box by using the Maths Box attributes dialogue box. |
|
6.
|
Use the Page Layout toolbar icon to select the split layout. |
|
7.
|
Add the Graph application and plot f1(x). |
See how the roots of f1 change when the function is modified in Graph.
Example #2: Using Notes to Explore Data Sampling
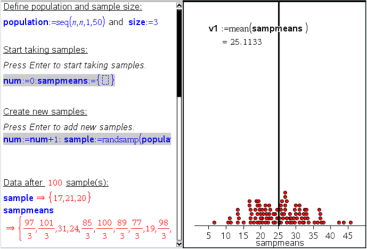
In this example, we create a sampling distribution of sample means drawn from a given population. We will be able to watch the sampling distribution take shape for a given sample size and describe its characteristics. You can change the population and the sample size.
|
1.
|
Set up the population and the sample size. |
|
a)
|
Type "Create sample data:" |
|
b)
|
Insert a maths expression box and define the population. For example, type "population:=seq(n,n,1,50)". |
|
c)
|
Press · and hide the output using the Maths Expression Box Attributes dialogue box. |
|
d)
|
Insert a maths expression box and define the sample size. For example, type "size:=5". |
|
e)
|
Press · and hide the output using the Maths Expression Box Attributes dialogue box. |
|
2.
|
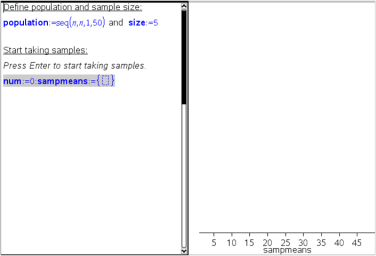
Set up the initialization. |
|
a)
|
Type "Start taking samples:" |
|
b)
|
Insert a maths expression box and set the initial values for the number of samples (num) and the list of sample means (sampmeans). Type: |
"num:=0:sampmeans:={}"
|
c)
|
Press · and hide the output using the Maths Expression Box Attributes dialogue box. |
|
d)
|
Deactivate the maths expression box using . The deactivation will prevent the content of that maths box from being overwritten when the values for num and sampmeans change. The deactivated maths box will be shown with the light colour background. |
|
3.
|
Set up Data & Statistics for the sampling. |
|
a)
|
Change the page layout and insert Data & Statistics. |
|
b)
|
Click on the horizontal axis and add sampmeans list. |
|
c)
|
Change the window setting: XMins=1 and XMax = 50. |
|
d)
|
You can also set up the plot of the mean of sample means using . |
|
4.
|
Enter the instructions to add data. |
|
a)
|
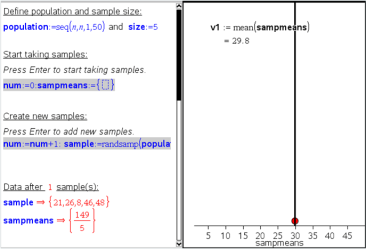
Type "Create new samples:" |
|
b)
|
Insert a maths expression to define the sample (sample) and update the number of samples and the list of sample means. Type: |
"num:=num+1:sample:=randsamp(population,size):
sampmeans:=augment(sampmeans,{mean(sample)})"
|
c)
|
Press ·, hide the output, and turn off the expression wrapping using the Maths Expression Box Attributes dialogue box. |
|
d)
|
Deactivate the maths expression box using to prevent the content of the maths box to be overwritten when num and sampmeans values are reinitialized. |
|
e)
|
Create maths expression boxes that display the current number of experiments (num), sample (sample) and the list of sample means (sampmeans). |
|
5.
|
Now you are ready to explore. Add more samples by simply pressing · when you are in the maths expression box in the "Create new samples" section. |
Note: You can also automate the sampling process by using a loop.
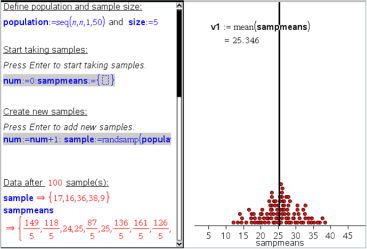
You can also change the sample size and restart the sampling.