You can graph a function or relation directly from its context menu. This feature is available for many functions and relations on Notes, Scratchpad and Calculator pages.
|
|
|
|
If page layout options allow, the graph appears on the same page as the function or relation. Otherwise, the graph appears on a separate Graphs page.
The type of graph created depends on:
| • | The type of function or relation. |
| • | Any restrictions imposed by an active Press-to-Test session. |
Example of Graphing from Notes
This example uses a Notes page to explore a quadratic function interactively.
| 1. | Insert a maths box on a new Notes page, and enter the following function definition: |
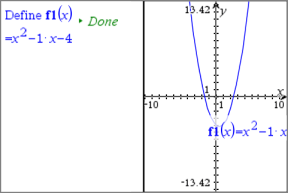
Define f1(x)=x2-1·x-4

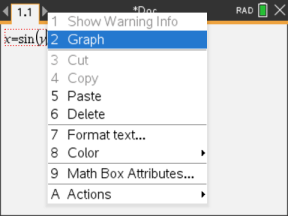
| 2. | Display the context menu of the Define statement. Windows®: Right-click the statement. Mac®: Hold “, and click the statement. Handheld: Point to the statement, and press / b. |
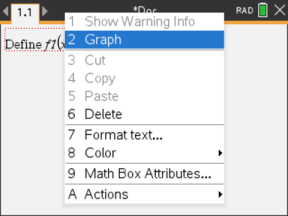
| 3. | Select Graph from the context menu. |
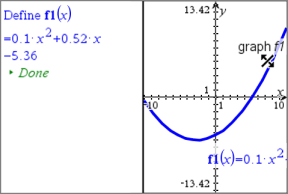
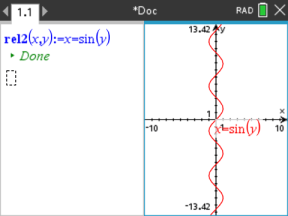
The graph appears. The graph and the maths box are linked so that any adjustment to one affects the other.
| 4. | Explore the relationship between the defined function and its graph: |
| - | Drag the ends or centre of the graph to manipulate it, and observe the changes to the function definition. |
—or—
| - | Edit the defined function in the maths box, and observe the changes to the graph. |