Tools on the Statistics menu provide access to wizards that help you perform statistical analyses on the data in table columns. You specify the location of the data, and Lists & Spreadsheet stores the results in two columns: one for the result names, and one for the corresponding values.
Plotting Statistical Data
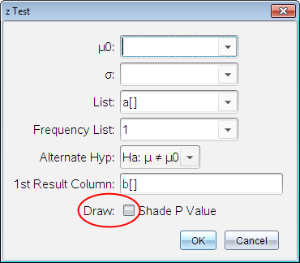
Some statistics wizards include a Draw box. By default, the box is not selected. Selecting this box creates a Data & Statistics work area on the page, displays the calculated results in Lists & Spreadsheet, and draws the results of the statistical analysis in the Data & Statistics work area.
Note: For functions that support the Draw option, the option is available only if you type the function in a column formula cell.
|
|