The Data & Statistics application lets you explore and visualise data and graph inferential statistics. The Lists & Spreadsheet application can work in conjunction with the Data & Statistics application. The Lists & Spreadsheet Summary Plot and Quick Graph tools automatically add a Data & Statistics application to show plots. A list that you create in a problem (using the Lists & Spreadsheet or Calculator applications) can be accessed as a variable in any TI-Nspire™ application in that problem.
 Changing Data & Statistics Settings
| 1. | From the Settings menu, select Settings. |
| 2. | Select the settings that you want to use. |
| • | Display Digits. Lets you select the display format for numeric labels in the current document. Select Auto to automatically follow the setting in the Document Settings dialogue box. |
| • | Diagnostics. Displays the value of the r2 or R2 statistic (when available) under certain regression equations. |
| - | r2 is displayed for Linear (mx+b), Linear (a+bx), Power, Exponential and Logarithmic regressions. |
| - | R2 is displayed for Quadratic, Cubic and Quartic regressions. |
The Data & Statistics application plots numeric and string (categorical) data from variables. When you add a Data & Statistics application to a problem that includes lists, a default caseplot displays on the work area.
The caseplot is like having a stack of cards with information on them and scattering the cards randomly on a table. You can click a dot to see the information on that “card”. You can drag a dot to “group” the “cards” by the caption variable.
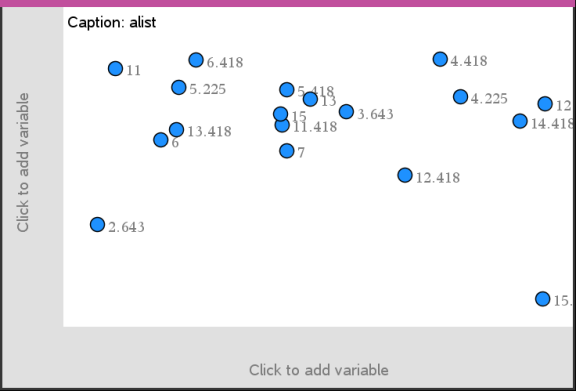
| ▶ | Click the variable name displayed after Caption to use the caseplot. |
| - | Choose <None> to remove the default caseplot. |
| - | Choose the name of a variable to have it replace the current caseplot variable. |
| - | Hover over any data point to see the summary information. |
| - | Drag any data point toward an axis to see how the points group. |
| - | Activate the Graph Trace tool and press ◄ or ► to move across points. |
When you add a variable to either axis, the plot for that variable replaces the default caseplot. The default caseplot redisplays if you remove the plotted variable from each axis.
The context menu provides access to the tools most commonly used with the selected object. The context menu displays different options depending on the active object and the task you are performing.
| ▶ | To open the context menu for an object. |
Windows®: Right-click the object.
Mac®: Hold “ and click the object.
Handheld: Point to the object and press / b.
The context menu includes the Colour option. You can use the Colour option to change the data to the colour of your choice.
Other options that are appropriate for various plots also appear on the context menu.
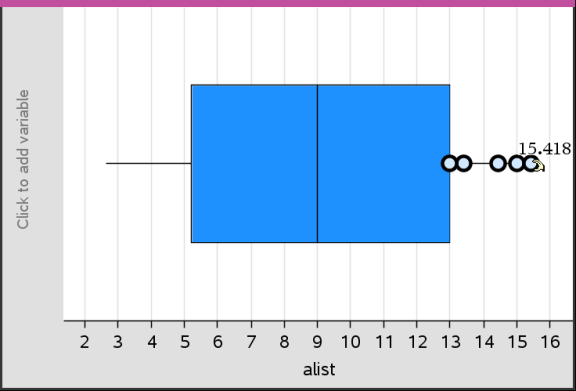
When you hover over part of a plot, the Data & Statistics application displays summary information for the data it represents.
| 1. | Hover at an area of interest in a plot to display data values or summary information. For example, you can hover over the centre of a box plot to display the median summary data. |
| 2. | Click once to select a representation of data in a plot. |
Data points are shown with a bold outline to indicate selection. You can click a point a second time to deselect it, or click additional points to add to the selection.
To plot variables, start with a problem that includes a Data & Statistics application and lists created in the Lists & Spreadsheet application or the Calculator application.
| 1. | Click the Add Variable region near the centre of an axis. |
If no variable is plotted on the axis, the tooltip Click or Enter to add variable displays.
| 2. | Click the tooltip Click or Enter to add variable. |
A list displays the names of available variables.

| 3. | Click the name of the variable to plot. |
Note: By convention, the independent variable is shown on the x-axis.
The default plot for one variable is a dot chart. The data points in the default caseplot reposition to represent the elements of the selected variable in a dot chart.
| 4. | (Optional) Click the Add Variable region near the centre of the remaining axis to plot a second variable. |
The default plot for two variables is a scatter plot. The data points shift to represent the elements of both variables as a scatter plot.
| 5. | (Optional) Repeat Steps 1-3 to choose additional variables to plot on the vertical axis. |
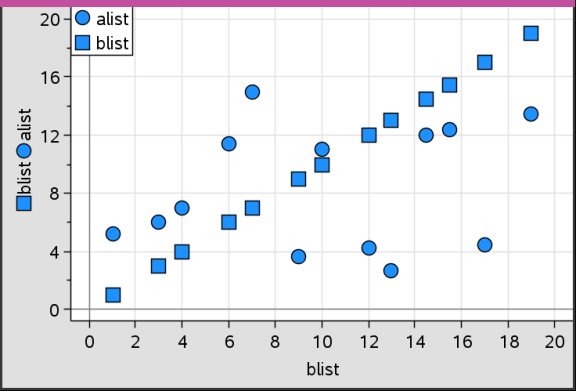
The name of each variable that you add is appended to the label on the axis. The default data point shape changes to help you distinguish data, and a legend is displayed to identify the shapes.
| 6. | Change, analyse or explore the plotted data. |
| - | Remove or change the variable on an axis by clicking the Add Variable region again. |
| - | View the plotted data in another supported plot type by selecting a tool from the Plot Types menu. |
| - | Choose the Graph Trace tool on the Analyse menu and press ◄ or ► to move across the data points in the plot. |
| - | The lists that you plot as variables can include incomplete or missing cases. (A case is the data contained in a row of cells in the Lists & Spreadsheet application.) The Lists & Spreadsheet application displays a void as an underscore (“_”), and Data & Statistics plots no data point for a void cell. |
You can manipulate data points on the Data & Statistics work area to explore their effects. For example, you could explore how a specific group of values affects the median.
You can move a data point only in directions allowed by its definition. If a list is defined with a formula in Lists & Spreadsheet, the points in Data & Statistics may not move because of the formula’s restrictions. For example, you can manipulate a plot that represents the result of y=x, but you can only move along a line.
You cannot move points that represent data in a locked variable or data that represents a categorical value.
| 1. | On the Data & Statistics work area, click a representation of data—such as a histogram bin or a whisker of a box plot—that is not locked or restricted by a formula. |
The pointer changes to an open hand to show that the data can be moved.
| 2. | Drag the selection to explore how different values of the point affect the plot. |
Handheld: Press / a to grab, and then swipe or use the arrow keys to drag.
As you drag, the changing value displays on the work area.