Use this option to add points to the graph to predict the outcome of an experiment.
| 1. | Click the Graph View tab |
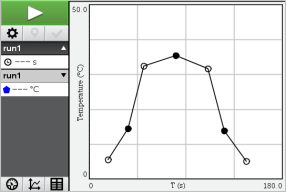
| 2. | From the Analyse menu, select Draw Prediction > Draw. |
| 3. | Click each area in which you want to place a point. |
| 4. | Press Esc to release the drawing tool. |
| 5. | To clear the drawn prediction, click Analyse > Draw Prediction > Clear. |